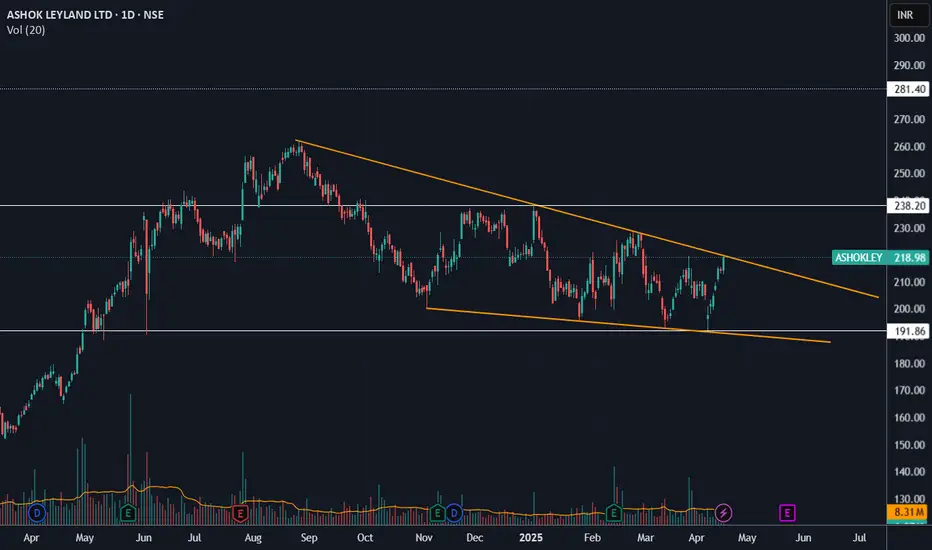
For the last nine months, Ashok Leyland has developed a falling wedge pattern. With the stock currently testing the upper trendline, a close above it would likely confirm a bullish breakout. It can reach 280 levels, as indicated by the pattern.
免责声明
这些信息和出版物并非旨在提供,也不构成TradingView提供或认可的任何形式的财务、投资、交易或其他类型的建议或推荐。请阅读使用条款了解更多信息。
免责声明
这些信息和出版物并非旨在提供,也不构成TradingView提供或认可的任何形式的财务、投资、交易或其他类型的建议或推荐。请阅读使用条款了解更多信息。