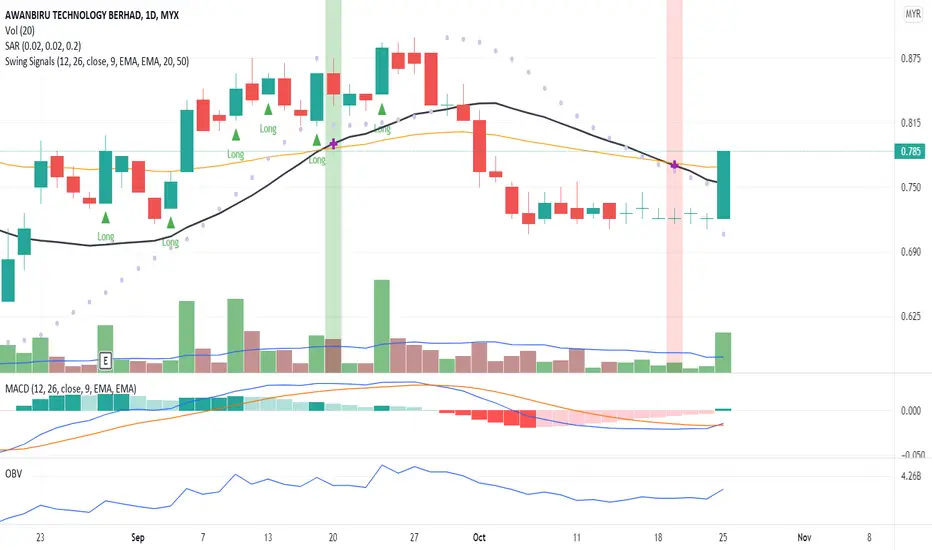
The candlestick indicates a price breakout from significant price movement with volume above MA20. The candlestick also closed above MA20. MACD and OBV charts indicate an early signal of divergence pattern. Therefore, chances of high probability it will be a long trade position. Put this in your WL and watch out price rally with volume and MA20 crosses up MA50.
R 0.810
S 0.755
R 0.810
S 0.755
免责声明
这些信息和出版物并非旨在提供,也不构成TradingView提供或认可的任何形式的财务、投资、交易或其他类型的建议或推荐。请阅读使用条款了解更多信息。
免责声明
这些信息和出版物并非旨在提供,也不构成TradingView提供或认可的任何形式的财务、投资、交易或其他类型的建议或推荐。请阅读使用条款了解更多信息。