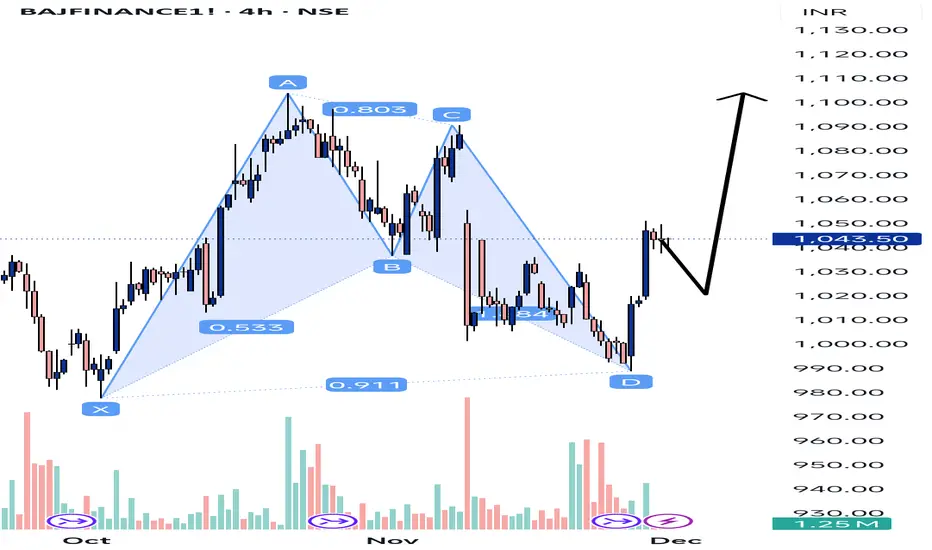
The shaded blue structure with points X – A – B – C – D is a harmonic pattern (looks like a bullish Gartley / Bat-type pattern):
X → A → B → C → D marks swings in price.
The little numbers like 0.803, 0.533, 0.911 are Fibonacci ratios used to validate the harmonic pattern.
Point D is at the bottom right – that’s usually the potential reversal zone (PRZ) where price is expected to stop falling and start moving up.
So:
👉 The pattern is suggesting bullish reversal from D (buyers stepping in around the lows near ₹990–1,000 area).
---
Current price action
After hitting D, price has bounced up and is now near ₹1,040+.
The candles from D to current level show recovery, confirming that the pattern’s reversal is (so far) working.
免责声明
这些信息和出版物并非旨在提供,也不构成TradingView提供或认可的任何形式的财务、投资、交易或其他类型的建议或推荐。请阅读使用条款了解更多信息。