📊 Market Structure Analysis
🔹 4H Chart
Price has broken out of the short-term downtrend channel and is trading within a rising parallel channel.
Current level: 54,532.
Immediate resistance zone: 54,800 – 55,400 (supply area + FVG).
Immediate support: 54,200 – 54,000 (recent OB + EMA zone).
Trend: Short-term bullish structure but still testing supply zones.
🔹 1H Chart
Strong Break of Structure (BOS) seen above 54,300.
Price is consolidating just below resistance (54,600 – 54,800).
EMA slope is positive, supporting upward bias.
Key liquidity: Buyside liquidity resting above 54,800.
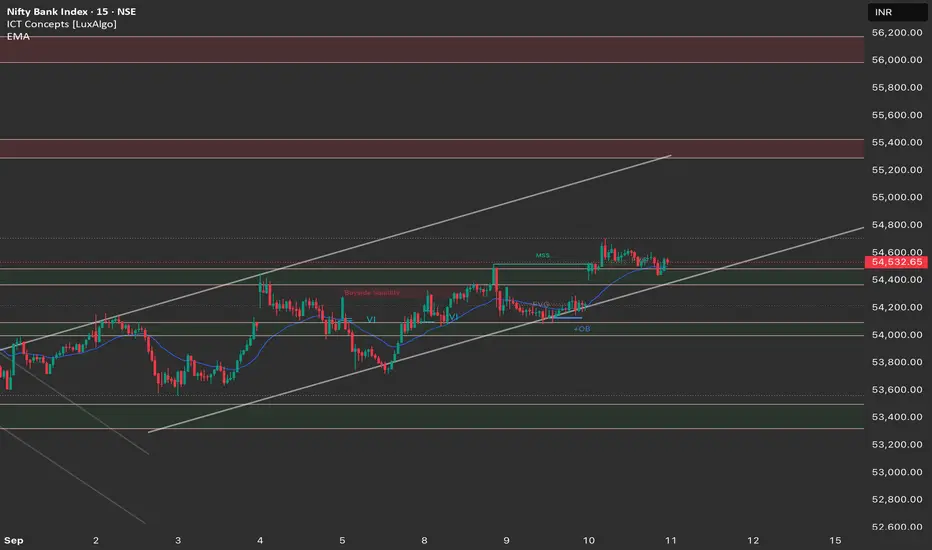
🔹 15M Chart
Price rejected from 54,600 resistance and is now retesting mid-channel support.
Multiple OB + FVG supports in 54,200 – 54,300 area.
Liquidity sweep likely before next move (either up to 54,800+ or breakdown).
🎯 Trade Plan for 11th September
🔹 Long Setup (Bullish Bias)
Entry Zone: 54,200 – 54,300 (OB + EMA support).
Target 1: 54,600
Target 2: 54,800 – 55,000 (liquidity sweep area).
Stop Loss: Below 54,000 (channel + OB invalidation).
🔹 Short Setup (If rejection holds)
Entry Zone: 54,600 – 54,800 (supply rejection).
Target 1: 54,300
Target 2: 54,000
Stop Loss: Above 55,000 (clear BOS against bearish plan).
⚖️ Bias Summary
Primary Bias: Bullish → long from dips towards 54,200 targeting 54,800+.
Alternate Bias: Bearish rejection if 54,600 supply holds → target back to 54,000.
🔹 4H Chart
Price has broken out of the short-term downtrend channel and is trading within a rising parallel channel.
Current level: 54,532.
Immediate resistance zone: 54,800 – 55,400 (supply area + FVG).
Immediate support: 54,200 – 54,000 (recent OB + EMA zone).
Trend: Short-term bullish structure but still testing supply zones.
🔹 1H Chart
Strong Break of Structure (BOS) seen above 54,300.
Price is consolidating just below resistance (54,600 – 54,800).
EMA slope is positive, supporting upward bias.
Key liquidity: Buyside liquidity resting above 54,800.
🔹 15M Chart
Price rejected from 54,600 resistance and is now retesting mid-channel support.
Multiple OB + FVG supports in 54,200 – 54,300 area.
Liquidity sweep likely before next move (either up to 54,800+ or breakdown).
🎯 Trade Plan for 11th September
🔹 Long Setup (Bullish Bias)
Entry Zone: 54,200 – 54,300 (OB + EMA support).
Target 1: 54,600
Target 2: 54,800 – 55,000 (liquidity sweep area).
Stop Loss: Below 54,000 (channel + OB invalidation).
🔹 Short Setup (If rejection holds)
Entry Zone: 54,600 – 54,800 (supply rejection).
Target 1: 54,300
Target 2: 54,000
Stop Loss: Above 55,000 (clear BOS against bearish plan).
⚖️ Bias Summary
Primary Bias: Bullish → long from dips towards 54,200 targeting 54,800+.
Alternate Bias: Bearish rejection if 54,600 supply holds → target back to 54,000.
免责声明
这些信息和出版物并非旨在提供,也不构成TradingView提供或认可的任何形式的财务、投资、交易或其他类型的建议或推荐。请阅读使用条款了解更多信息。
免责声明
这些信息和出版物并非旨在提供,也不构成TradingView提供或认可的任何形式的财务、投资、交易或其他类型的建议或推荐。请阅读使用条款了解更多信息。