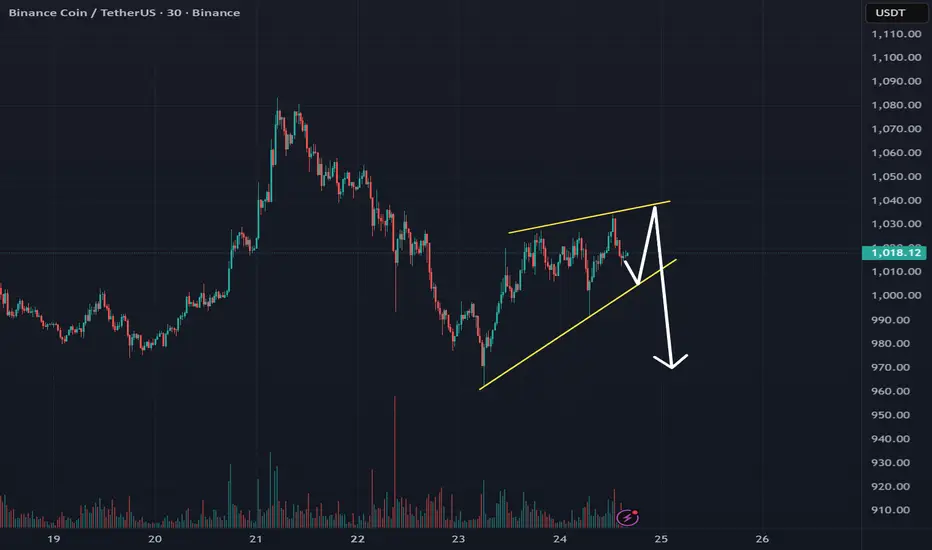
BNB is forming a bearish wedge pattern on the 15-minute chart
This pattern is bearish and formed within the boundaries of a global bearish flag pattern
Current price: $1016
According to the movement within the local wedge, a downward breakout is expected.
The price may reach $1000 and below
Within the pattern, false breakouts to $1050 are possible
---
More detailed analysis, additional charts, and key levels to watch are available on our website
免责声明
这些信息和出版物并非旨在提供,也不构成TradingView提供或认可的任何形式的财务、投资、交易或其他类型的建议或推荐。请阅读使用条款了解更多信息。