I had to Docukent this trade because it reminds of the time.
This time was slow.I tried to buy between two Moving Averages.
The 50 EMA and the 200 EMA.
Then I put a chart pattern.
This chart pattern is called the trendline support.
But there is a problem.
How do I use a chart pattern on forex trading?
And how do I trade with confidence so I used the following.
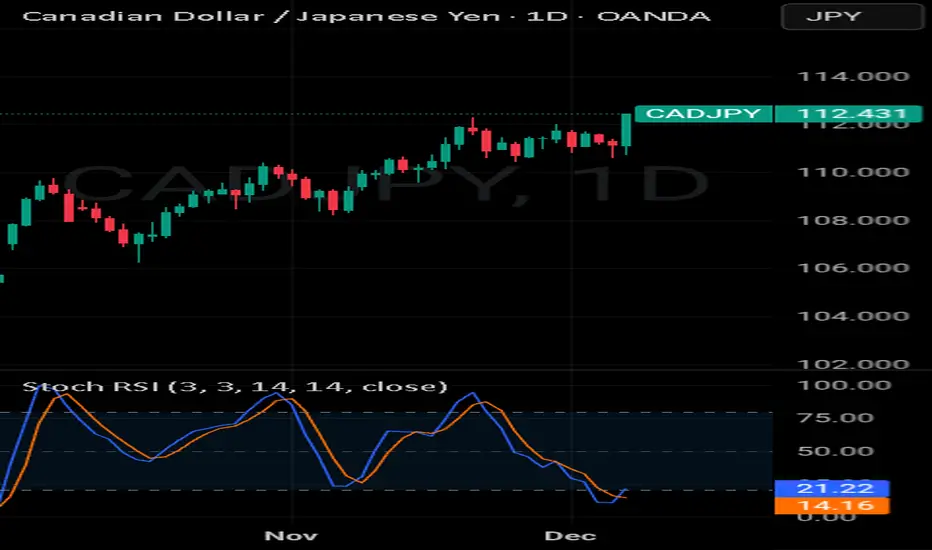
1-The trendline support
2-The Stochastic
3-RSI
These three tools are the mistakes that forex traders don't use.
Rocket boost this content to learn more.
Disclaimer ⚠️ Trading is risky please learn about risk management and profit taking strategies.
Also feel free to use a simulation trading account before you use real money.
This time was slow.I tried to buy between two Moving Averages.
The 50 EMA and the 200 EMA.
Then I put a chart pattern.
This chart pattern is called the trendline support.
But there is a problem.
How do I use a chart pattern on forex trading?
And how do I trade with confidence so I used the following.
1-The trendline support
2-The Stochastic
3-RSI
These three tools are the mistakes that forex traders don't use.
Rocket boost this content to learn more.
Disclaimer ⚠️ Trading is risky please learn about risk management and profit taking strategies.
Also feel free to use a simulation trading account before you use real money.
免责声明
这些信息和出版物并非旨在提供,也不构成TradingView提供或认可的任何形式的财务、投资、交易或其他类型的建议或推荐。请阅读使用条款了解更多信息。