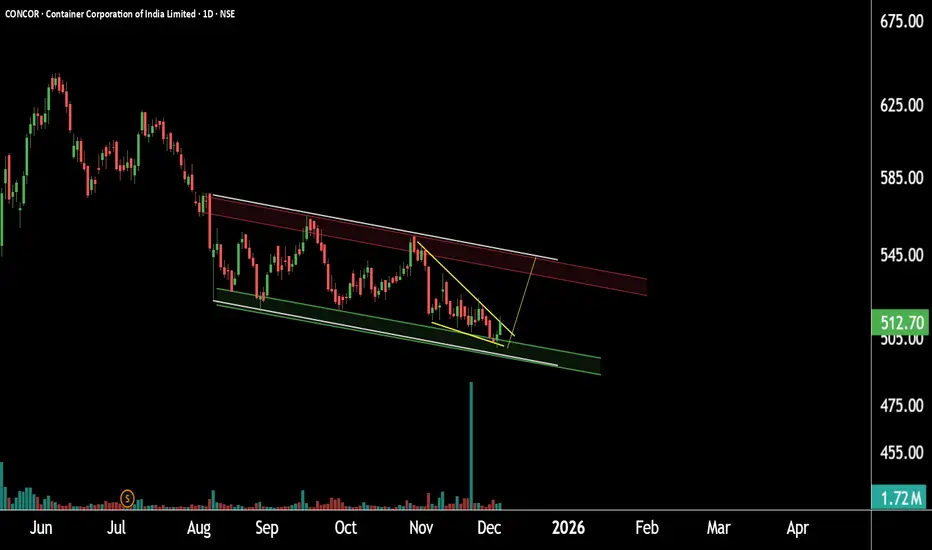
This is the daily timeframe chart of Concor.
The stock is trading within a falling channel pattern, with a strong support zone around 490–510.
On the shorter timeframe, the structure is forming a falling wedge near the 500–510 area. If this support zone holds,
the stock may witness a potential upside toward 540.
Thank you.
The stock is trading within a falling channel pattern, with a strong support zone around 490–510.
On the shorter timeframe, the structure is forming a falling wedge near the 500–510 area. If this support zone holds,
the stock may witness a potential upside toward 540.
Thank you.
@RahulSaraoge
Connect us at t.me/stridesadvisory
Connect us at t.me/stridesadvisory
免责声明
这些信息和出版物并非旨在提供,也不构成TradingView提供或认可的任何形式的财务、投资、交易或其他类型的建议或推荐。请阅读使用条款了解更多信息。
@RahulSaraoge
Connect us at t.me/stridesadvisory
Connect us at t.me/stridesadvisory
免责声明
这些信息和出版物并非旨在提供,也不构成TradingView提供或认可的任何形式的财务、投资、交易或其他类型的建议或推荐。请阅读使用条款了解更多信息。