A “Dragonfly” doji depicts a day on which prices opened high, sold off, and then returned to the opening price. Dragonflies are fairly infrequent. When they do occur, however, they often resolve bullishly (provided the Forex pair is not already overbought as show by Bollinger bands and indicators such as stochastic).
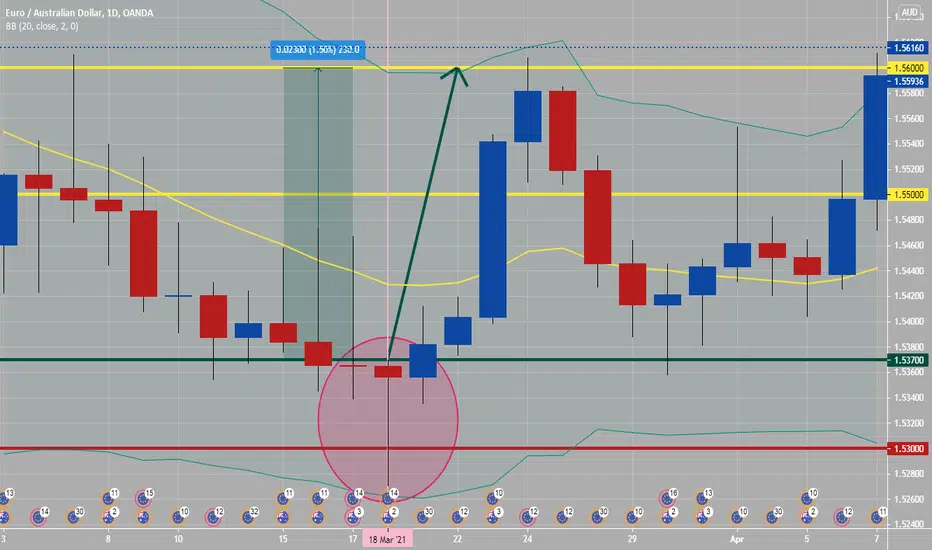
See daily attached chart of dragon fly candle, which was oversold and located at the lower band of Bollinger bands and at round numbers from 1.53000 to 1.53700. This is a great candlestick to plan for price action to continue to be bullish from, especially if this happened early in week. Noted dragonfly doji happened on a Thursday and lasted for around five days.
See daily attached chart of dragon fly candle, which was oversold and located at the lower band of Bollinger bands and at round numbers from 1.53000 to 1.53700. This is a great candlestick to plan for price action to continue to be bullish from, especially if this happened early in week. Noted dragonfly doji happened on a Thursday and lasted for around five days.
免责声明
这些信息和出版物并非旨在提供,也不构成TradingView提供或认可的任何形式的财务、投资、交易或其他类型的建议或推荐。请阅读使用条款了解更多信息。