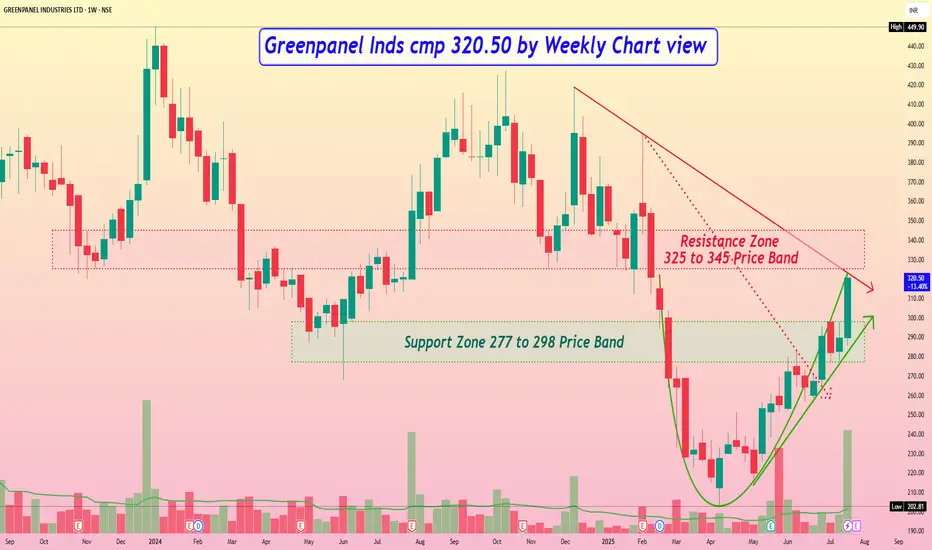
Greenpanel Inds cmp 320.50 by Weekly Chart view
- Support Zone 277 to 298 Price Band
- Resistance Zone 325 to 345 Price Band
- Bullish Rounding Bottom with Resistance Zone neckline
- Rising Support Trendline seems well respected by price momentum
- Volumes have surged very heavily over past week by demand based buying
- 1st Falling Resistance Trendline Brake out done and 2nd Trendline Breakout attempted
- Most common Technical Indicators like BB, EMA, MACD, RSI, SAR are showing positive trend
免责声明
这些信息和出版物并非旨在提供,也不构成TradingView提供或认可的任何形式的财务、投资、交易或其他类型的建议或推荐。请阅读使用条款了解更多信息。
免责声明
这些信息和出版物并非旨在提供,也不构成TradingView提供或认可的任何形式的财务、投资、交易或其他类型的建议或推荐。请阅读使用条款了解更多信息。