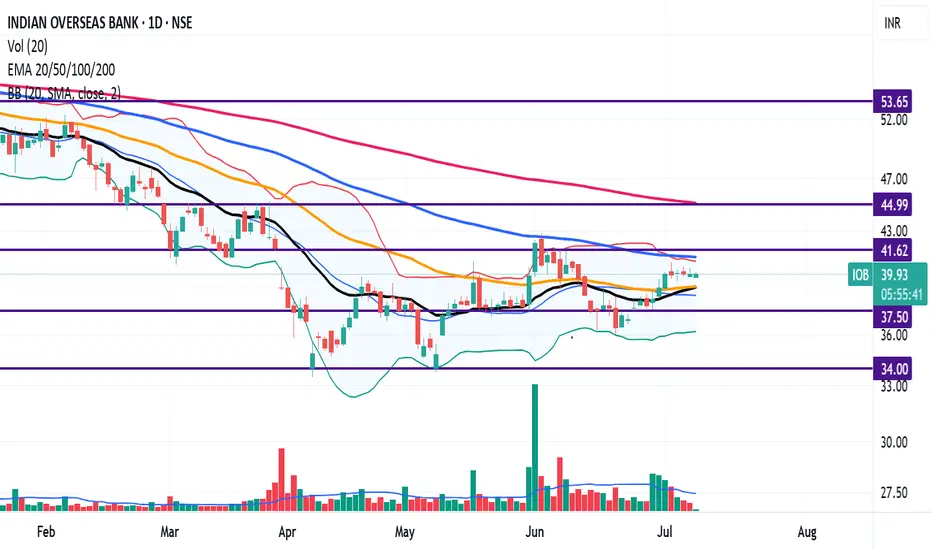
IOB is taking strong support around 20 EMA (Black Line),
We can confirm the bullish trend in the stock when 20 EMA (Black Line) cross above 50 EMA (Orange Line) decisively in the weekly chart.
IOB is 44.86% away from 52 week high and
19.49% away from 52 week low
The stocks is showing Mid Range Momentum when compared to Short, Medium and Long Term Moving Averages
Resistance levels: 41.6, 45, 54
Support levels: 37.5, 34
免责声明
这些信息和出版物并非旨在提供,也不构成TradingView提供或认可的任何形式的财务、投资、交易或其他类型的建议或推荐。请阅读使用条款了解更多信息。
免责声明
这些信息和出版物并非旨在提供,也不构成TradingView提供或认可的任何形式的财务、投资、交易或其他类型的建议或推荐。请阅读使用条款了解更多信息。