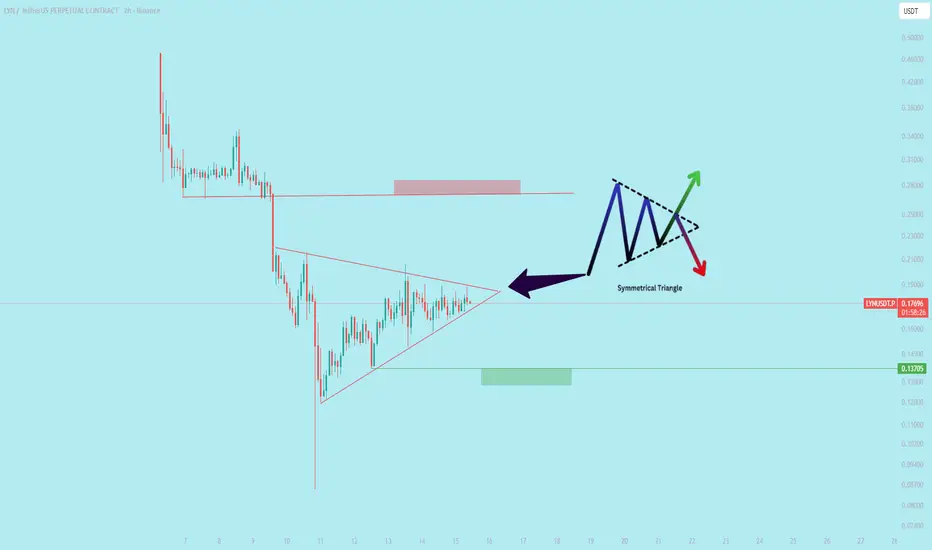
**$LYN** **Performing a symmetrical triangle** `symmetrical triangle is a chart pattern formed by two converging trendlines that connect a series of lower highs and higher lows. It represents a period of market consolidation and indecision, with neither buyers nor sellers having a clear advantage. The price range narrows as it moves toward the triangle's apex, or point of convergence.`
免责声明
这些信息和出版物并不意味着也不构成TradingView提供或认可的金融、投资、交易或其它类型的建议或背书。请在使用条款阅读更多信息。
免责声明
这些信息和出版物并不意味着也不构成TradingView提供或认可的金融、投资、交易或其它类型的建议或背书。请在使用条款阅读更多信息。