Not an Advisor.
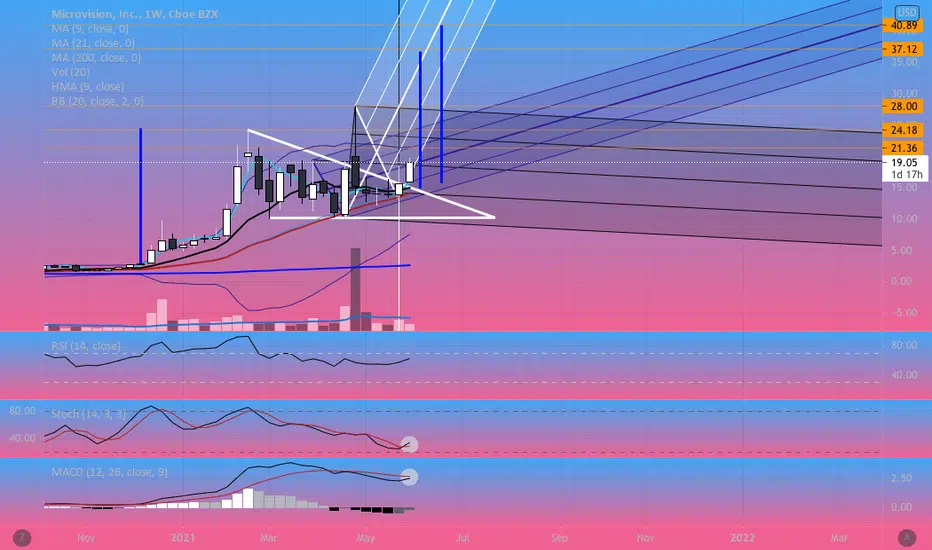
This chart is a bit messy so I apologize in advance. Weekly Chart for MVIS is showing monster potential.
Looking to cross bullish on the MACD
Stoch lines are looking like they may start that movement upward signaling strength to come to this chart.
RSI is only at 62! Plenty of room to run here.
Still awaiting on Volume to match the weekly average of just a bit over 100 million, currently at half of that with 2 days left this week of trading.
Watching this closely to see what pitchforks further get validated with price action this week.
Blue lines are flag measurements to gather price targets.
Gold lines are areas of previous resistance/ support. Also price targets.
免责声明
这些信息和出版物并非旨在提供,也不构成TradingView提供或认可的任何形式的财务、投资、交易或其他类型的建议或推荐。请阅读使用条款了解更多信息。
免责声明
这些信息和出版物并非旨在提供,也不构成TradingView提供或认可的任何形式的财务、投资、交易或其他类型的建议或推荐。请阅读使用条款了解更多信息。