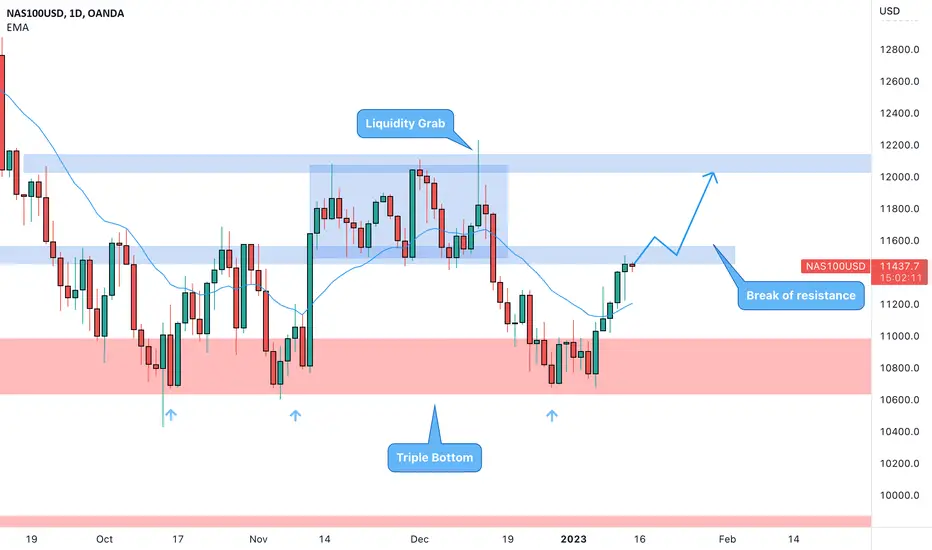
NAS100USD on the daily chart has created a triple bottom.
The market tested a few times the weekly support at the 10700 level and we notice how after the first 2 tests the market went up for a distribution phase.
It is interesting to see the liquidity grab before the next bearish leg to the support where, also thanks to the recent news we had a new inversion at the support level.
How can i approach this scenario?
Being Friday it will be risky to open a position but IF the price will break above the resistance area we can set a nice long order according to the Plancton's strategy rules.
–––––
Follow the Shrimp 🦐
Keep in mind.
🟣 Purple structure -> Monthly structure.
🔴 Red structure -> Weekly structure.
🔵 Blue structure -> Daily structure.
🟡 Yellow structure -> 4h structure.
⚫️ Black structure -> <4h structure.
Here is the Plancton0618 technical analysis , please comment below if you have any question.
The ENTRY in the market will be taken only if the condition of the Plancton0618 strategy will trigger.
注释
注释
注释
免责声明
这些信息和出版物并不意味着也不构成TradingView提供或认可的金融、投资、交易或其它类型的建议或背书。请在使用条款阅读更多信息。