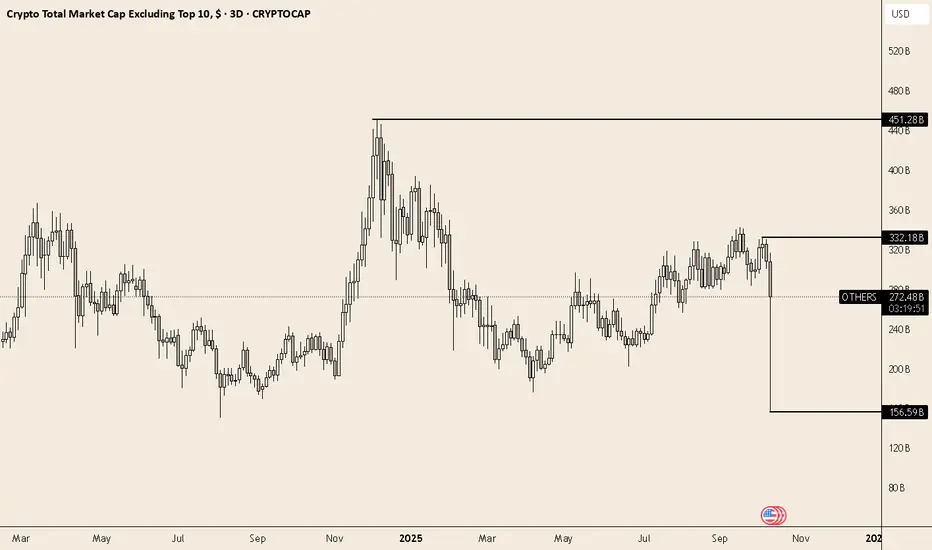
The Total Crypto Market Cap excluding the Top 10 coins shows how extreme Friday’s move really was.
At the beginning of October, the “ OTHERS” segment stood near $332B.
By the end of Friday’s crash, it had dropped to just $156B — a −53% drawdown in a matter of hours, wiping out months of speculative buildup.
Since then, the index has rebounded +73% from the lows, suggesting an aggressive short-covering rally rather than organic accumulation.
🔍 Key zones to watch:
$332B → prior range top / first resistance
$156B → capitulation low / liquidity sweep
The structure remains fragile — higher volatility and thin liquidity can amplify both sides of the move.
Until this chart rebuilds a base above $300B, altcoins remain in a vulnerable phase of the cycle.
At the beginning of October, the “
By the end of Friday’s crash, it had dropped to just $156B — a −53% drawdown in a matter of hours, wiping out months of speculative buildup.
Since then, the index has rebounded +73% from the lows, suggesting an aggressive short-covering rally rather than organic accumulation.
🔍 Key zones to watch:
$332B → prior range top / first resistance
$156B → capitulation low / liquidity sweep
The structure remains fragile — higher volatility and thin liquidity can amplify both sides of the move.
Until this chart rebuilds a base above $300B, altcoins remain in a vulnerable phase of the cycle.
免责声明
这些信息和出版物并不意味着也不构成TradingView提供或认可的金融、投资、交易或其它类型的建议或背书。请在使用条款阅读更多信息。
免责声明
这些信息和出版物并不意味着也不构成TradingView提供或认可的金融、投资、交易或其它类型的建议或背书。请在使用条款阅读更多信息。