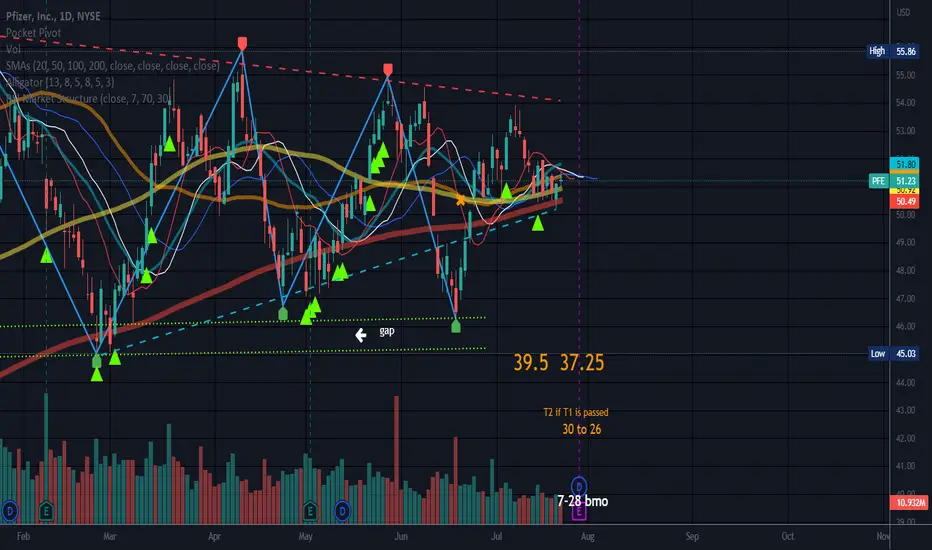
Earnings 7-28 BMO
Neutral pattern until a trendline is broken.
Targets over the triangle are bullish targets if triangle breaks to the upside.
Targets below the structure are bearish targets if this breaks to the downside.
Price has broken bottom trendline of the triangle and recovered using a prior gap as support.
Doji candle on Friday/indecision.
Short percent is 1.23% approximate and ratio is 2.9.
Earnings can make going long or short tricky so I will wait and see what happens. Longer term I feel this is a short due to the rising wedge. You may see this chart differently than I do.
No recommendation.
There is an old bearish rising wedge ( LOOK LEFT) in this chart just below $40. This pattern has not been validated. This pattern is not valid until the bottom trendline is broken. If history repeats itself, this rising wedge will eventually be broken.
免责声明
这些信息和出版物并非旨在提供,也不构成TradingView提供或认可的任何形式的财务、投资、交易或其他类型的建议或推荐。请阅读使用条款了解更多信息。