Execution model
When a Pine script is loaded on a chart it executes once on each historical bar using the available OHLCV (open, high, low, close, volume) values for each bar. Once the script’s execution reaches the rightmost bar in the dataset, if trading is currently active on the chart’s symbol, then Pine studies will execute once every time an update occurs, i.e., price or volume changes. Pine strategies will by default only execute when the rightmost bar closes, but they can also be configured to execute on every update, like studies do.
All symbol/resolution pairs have a dataset comprising a limited number of bars. When you scroll a chart to the left to see the dataset’s earlier bars, the corresponding bars are loaded on the chart. The loading process stops when there are no more bars for that particular symbol/resolution pair or approximately 10000 bars have been loaded [1]. You can scroll the chart to the left until the very first bar of the dataset, which has an index value of 0 (see bar_index).
All bars in a dataset are historical bars, except the rightmost one if a trading session is active. When trading is active in the rightmost bar, it is called the realtime bar. The realtime bar updates when a price or volume change is detected. When the realtime bar closes it becomes a historical bar and a new realtime bar opens.
Calculation based on historical bars
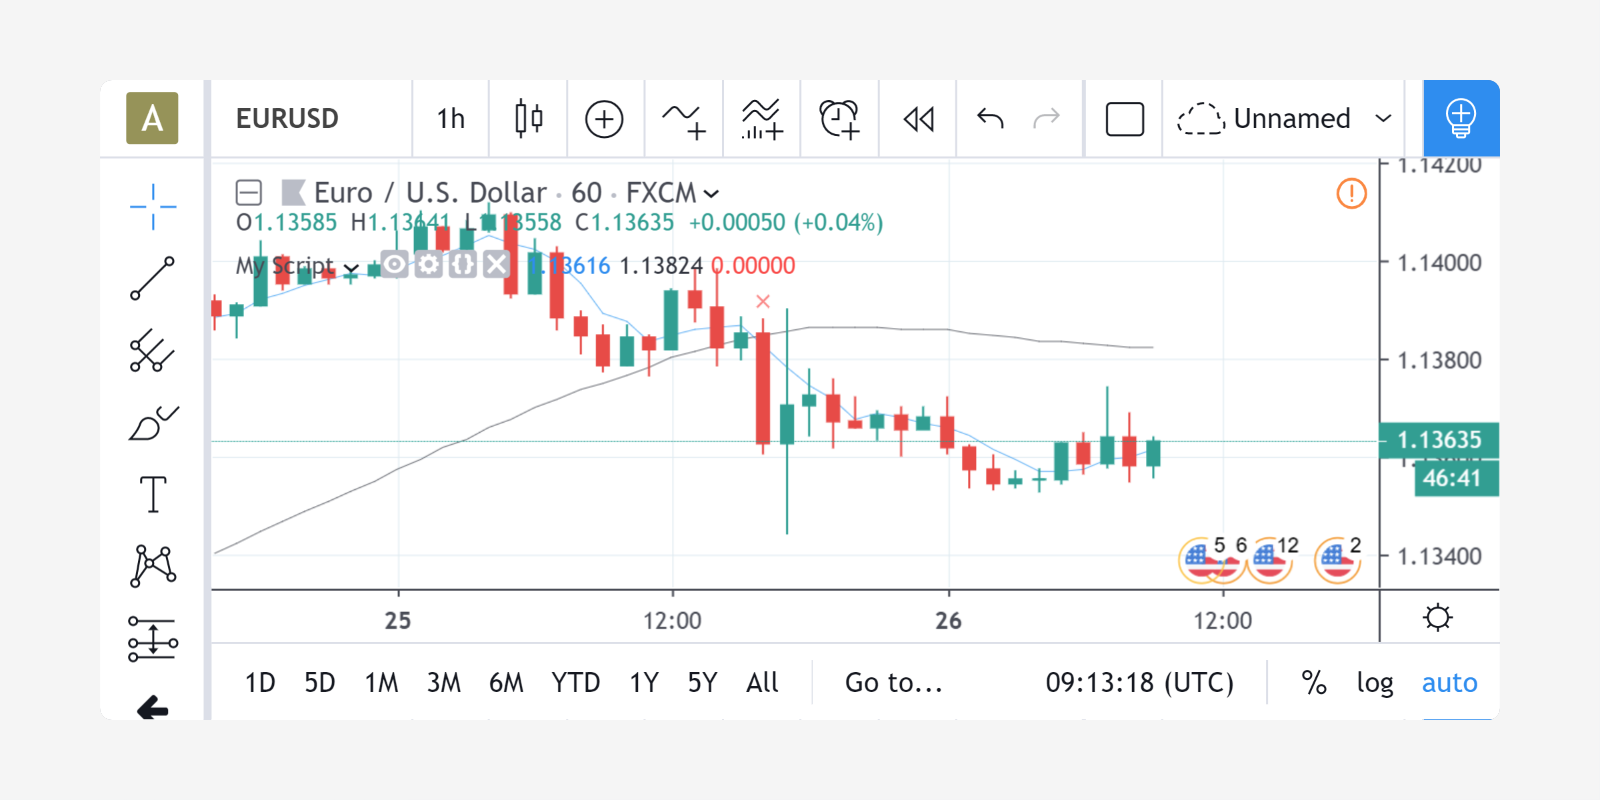
Let’s take a simple script and follow its execution on historical bars:
//@version=4
study("My Script", overlay=true)
src = close
a = sma(src, 5)
b = sma(src, 50)
c = cross(a, b)
plot(a, color=color.blue)
plot(b, color=color.black)
plotshape(c, color=color.red)
On historical bars, a script executes at the equivalent of the bar’s close, when the OHLCV values are all known for that bar. Prior to execution of the script on a bar, the built-in variables such as open, high, low, close, volume and time are set to values corresponding to those from that bar. A script executes once per historical bar.
Our example script is first executed on the very first bar of the dataset at index 0. Each statement is executed using the values for the current bar. Accordingly, on the first bar of the dataset, the following statement:
src = close
initializes the variable src with the close value for that first bar, and each of the next lines is executed in turn. Because the script only executes once for each historical bar, the script will always calculate using the same close value for a specific historical bar.
The execution of each line in the script produces calculations which in turn generate the study’s output values, which can then be plotted on the chart. Our example uses the plot and plotshape calls at the end of the script to output some values. In the case of a strategy, the outcome of the calculations can be used to plot values or dictate the orders to be placed.
After execution and plotting on the first bar, the script is executed on the dataset’s second bar, which has an index of 1. The process then repeats until all historical bars in the dataset are processed and the script reaches the rightmost bar on the chart.
Calculation based on realtime bars
The behavior of a Pine script on the realtime bar is very different than on historical bars. Recall that the realtime bar is the rightmost bar on the chart when trading is active on the chart’s symbol. Also, recall that strategies can behave in two different ways in the realtime bar. By default, they only execute when the realtime bar closes, but the calc_on_every_tick parameter of the strategy declaration statement can be set to true to modify the strategy’s behavior so that it executes each time the realtime bar updates, as studies do. The behavior described here for studies will thus only apply to strategies using calc_on_every_tick=true.
The most important difference between execution of scripts on historical and realtime bars is that while they execute only once on historical bars, scripts execute every time an update occurs during a realtime bar. This entails that built-in variables such as high, low and close which never change on a historical bar, can change at each of a script’s iteration in the realtime bar. Changes in the built-in variables used in the script’s calculations will, in turn, induce changes in the results of those calculations. This is required for the script to follow the realtime price action. As a result, the same script may produce different results every time it executes during the realtime bar.
Note: In the realtime bar, the close variable always represents the current price. Similarly, the high and low built-in variables represent the highest high and lowest low reached since the realtime bar’s beginning. The Pine built-in variables will only represent the realtime bar’s final values on the bar’s last update.
Let’s follow our script example in the realtime bar.
When the script arrives on the realtime bar it executes a first time. It uses the current values of the built-in variables to produce a set of results and plots them if required. Before the script executes another time when the next update happens, its user-defined variables are reset to a known state corresponding to that of the last commit at the close of the previous bar. If no commit was made on the variables because they are initialized every bar, then they are reinitialized. In both cases their last calculated state is lost. The state of plotted labels and lines is also reset. This resetting of the script’s user-defined variables and drawings prior to each new iteration of the script in the realtime bar is called rollback. Its effect is to reset the script to the same known state it was in when the realtime bar opened, so calculations in the realtime bar are always performed from a clean state.
The constant recalculation of a script’s values as price or volume changes in the realtime bar can lead to a situation where variable c in our example becomes true because a cross has occurred, and so the red marker plotted by the script’s last line would appear on the chart. If on the next price update the price has moved in such a way that the close value no longer produces calculations making c true because there is no longer a cross, then the marker previously plotted will disappear.
When the realtime bar closes, the script executes a last time. As usual, variables are rolled back prior to execution. However, since this iteration is the last one on the realtime bar, variables are committed to their final values for the bar when calculations are completed.
To summarize the realtime bar process:
- A script executes at the open of the realtime bar and then once per update.
- Variables are rolled back before every realtime update.
- Variables are committed once at the closing bar update.
Events triggering the execution of a script
A script is executed on the complete set of bars on the chart when one of the following events occurs:
- A new symbol or resolution is loaded on a chart.
- A script is saved or added to the chart from the Pine Editor.
- A value is modified in the script’s Settings/Inputs dialog box.
- A value is modified in a strategy’s Settings/Properties dialog box.
- A browser refresh event is detected.
A script is executed on the realtime bar when trading is active and:
- One of the above conditions occurs, causing the script to execute on the open of the realtime bar, or
- The realtime bar updates because a price or volume change was detected.
Note that when a chart is left untouched when the market is active, a succession of realtime bars which have been opened and then closed will trail the current realtime bar. While these bars will have been confirmed because their variables have all been committed, the script will not yet have executed on them in their historical state, since they did not exist when the script was last run on the chart’s dataset.
When an event triggers the execution of the script on the chart and causes it to run on those bar which have now become historical bars, the script’s calculation can sometimes vary from what they were when calculated on the last closing update of the same bars when they were realtime bars. This is due to slight variations between the OHLCV values saved at the close of realtime bars and those fetched from data feeds when the same bars have become historical bars. This behavior is also referred to as repainting.
Additional resources
A number of barstate.* built-in variables provide information about the current type of bar update
(historical, realtime, closing, etc.). The page where they are documented also contains a script that allows you to visualize the distinction described above between elapsed realtime bars and historical bars: Bar states. Built-in variables barstate.*.
This page explains the details of strategy calculations: Strategies.
Footnotes
| [1] | The upper limit for the total number of historical bars is about 10000 for Pro/Premium users. Free users are able to see about 5000 bars. |