Levels
`hline()` levels
Levels are lines plotted using the hline() function. It is designed to plot horizontal levels using a single color, i.e., it does not change on different bars. See the Levels section of the page on plot() for alternative ways to plot levels when hline() won’t do what you need.
The function has the following signature:
hline(price, title, color, linestyle, linewidth, editable) → hline
hline() has a few constraints when compared to plot():
- Since the function’s objective is to plot horizontal lines, its
priceparameter requires an “input int/float” argument, which means that “series float” values such as close or dynamically-calculated values cannot be used. - Its
colorparameter requires an “input int” argument, which precludes the use of dynamic colors, i.e., colors calculated on each bar — or “series color” values. - Three different line styles are supported through the
linestyleparameter:hline.style_solid,hline.style_dottedandhline.style_dashed.
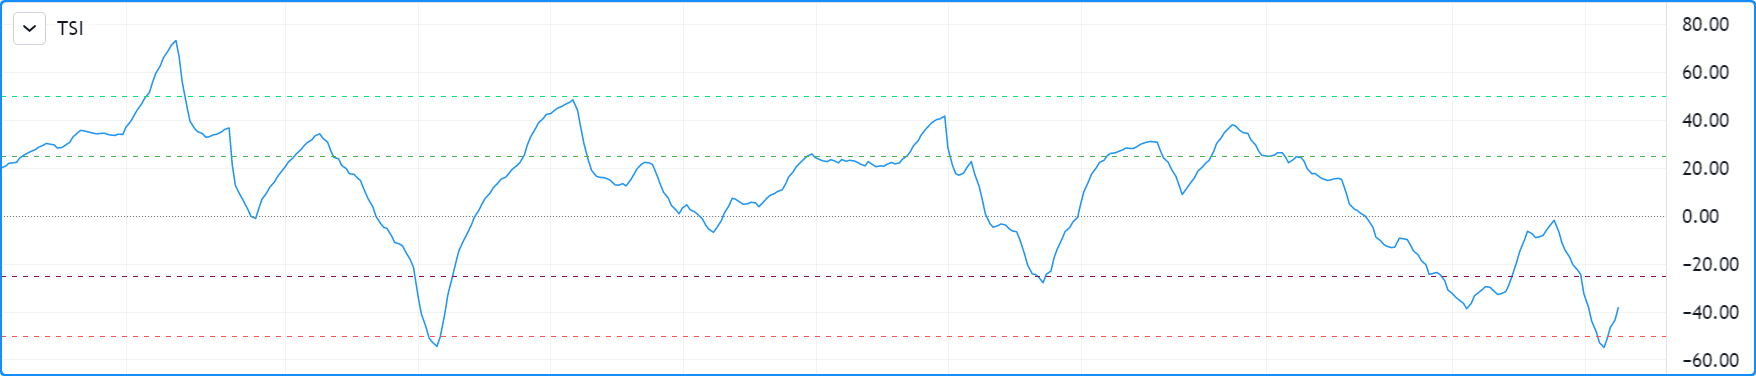
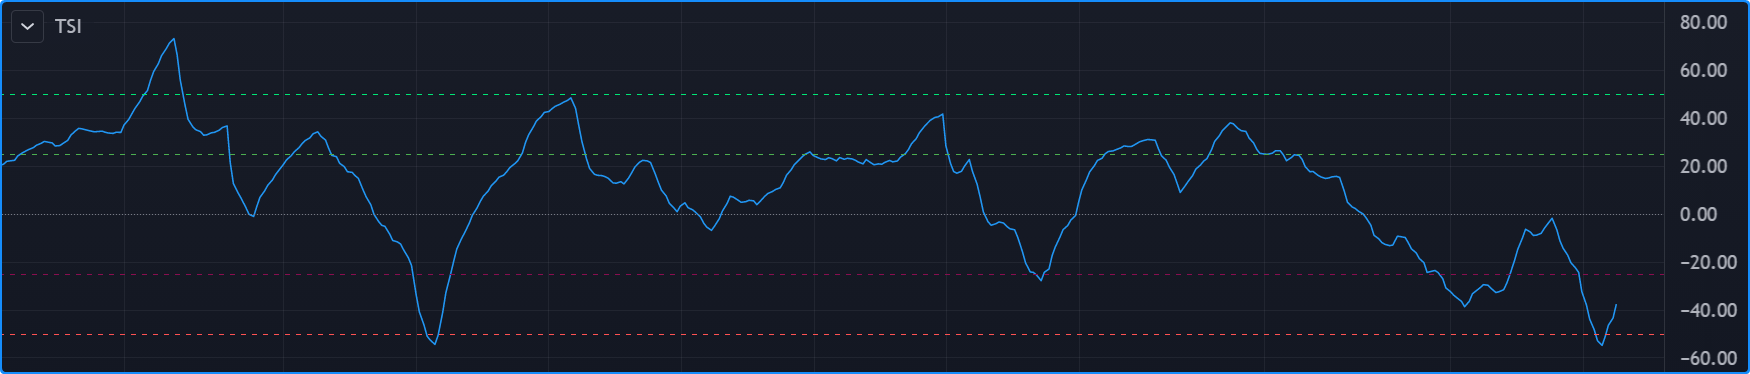
Let’s see hline() in action in the “True Strength Index” indicator:
//@version=5
indicator("TSI")
myTSI = 100 * ta.tsi(close, 25, 13)

hline( 50, "+50",  color.lime)
hline( 25, "+25",  color.green)
hline(  0, "Zero", color.gray, linestyle = hline.style_dotted)
hline(-25, "-25",  color.maroon)
hline(-50, "-50",  color.red)

plot(myTSI)
Note that:
- We display 5 levels, each of a different color.
- We use a different line style for the zero centerline.
- We choose colors that will work well on both light and dark themes.
- The usual range for the indicator’s values is +100 to -100. Since the ta.tsi() built-in returns values in the +1 to -1 range, we make the adjustment in our code.
Fills between levels
The space between two levels plotted with hline() can be colored using fill(). Keep in mind that both plots must have been plotted with hline().
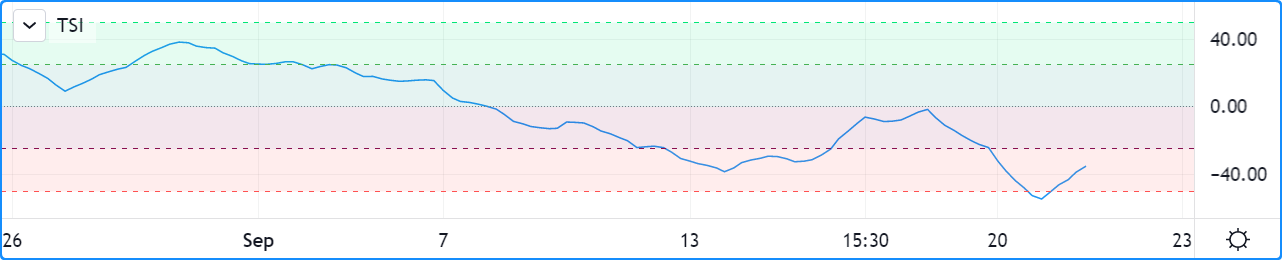
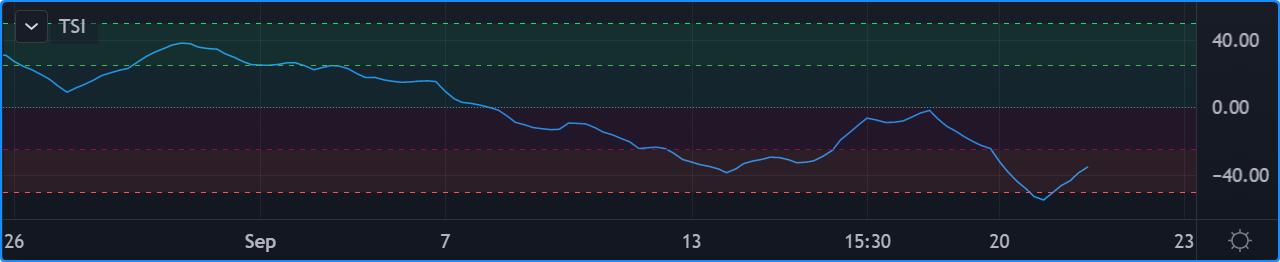
Let’s put some background colors in our TSI indicator:
//@version=5
indicator("TSI")
myTSI = 100 * ta.tsi(close, 25, 13)

plus50Hline  = hline( 50, "+50",  color.lime)
plus25Hline  = hline( 25, "+25",  color.green)
zeroHline    = hline(  0, "Zero", color.gray, linestyle = hline.style_dotted)
minus25Hline = hline(-25, "-25",  color.maroon)
minus50Hline = hline(-50, "-50",  color.red)

// ————— Function returns a color in a light shade for use as a background.
fillColor(color col) =>
    color.new(col, 90)

fill(plus50Hline,  plus25Hline,  fillColor(color.lime))
fill(plus25Hline,  zeroHline,    fillColor(color.teal))
fill(zeroHline,    minus25Hline, fillColor(color.maroon))
fill(minus25Hline, minus50Hline, fillColor(color.red))

plot(myTSI)
Note that:
- We have now used the return value of our
hline() function calls,
which is of the hline special type.
We use the
plus50Hline,plus25Hline,zeroHline,minus25Hlineandminus50Hlinevariables to store those “hline” IDs because we will need them in our fill() calls later. - To generate lighter color shades for the background colors,
we declare a
fillColor()function that accepts a color and returns its 90 transparency. We use calls to that function for thecolorarguments in our fill() calls. - We make our fill() calls for each of the four different fills we want, between four different pairs of levels.
- We use
color.tealin our second fill because it produces a green that fits the color scheme better than thecolor.greenused for the 25 level.