OPEN-SOURCE SCRIPT
Moving Average + Candle Leverage
What if you could extract more value from each trade based on your stop loss and entry, increasing your leverage safely? Could your winning trades be even more profitable?
This indicator uses a single selectable moving average (SMA, EMA, WMA, HMA, or VWMA) to calculate safe leverage per candle, allowing traders to maximize each trade within a defined stop loss. Actual profit remains variable depending on market movement and applied leverage.
How signals appear and how leverage is determined
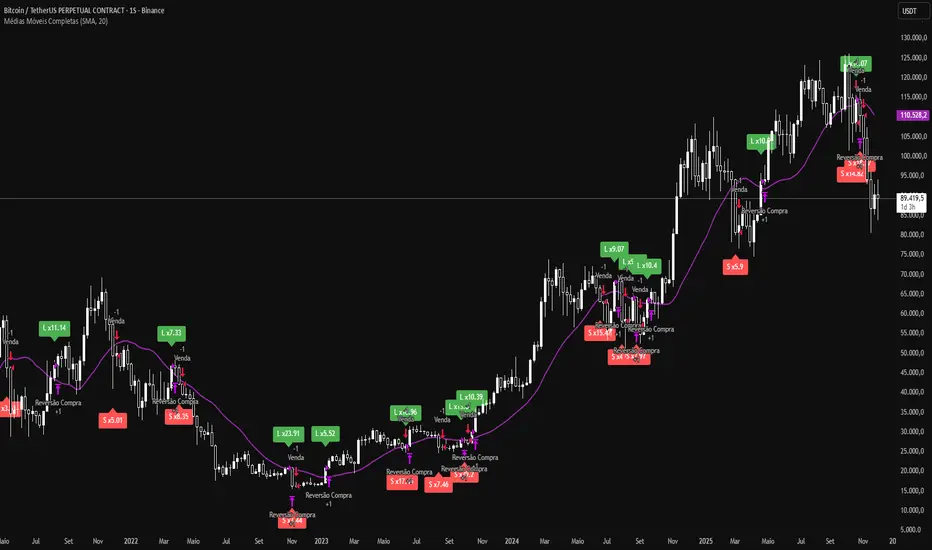
L (green): signals that price crossed above the moving average (potential long entry).
S (red): signals that price crossed below the moving average (potential short entry).
Each crossover shows a label with “x”, indicating the theoretical safe leverage for that candle.
How safe leverage is calculated:
Long: close ÷ (close − candle low)
Short: close ÷ (candle high − close)
How leverage is applied:
Identify the signal candle and record close, high, and low.
Calculate the difference between the close price and the stop price (low for Long, high for Short).
The percentage difference between these prices is our safe leverage: the smaller the difference, the higher the leverage possible, always respecting the stop loss.
The “x” label shows this maximum leverage, protecting the position balance using the candle’s stop loss.
Actual profit will still depend on market movement, but the stop loss is already defined and secure.
Main benefits:
Maximize trade potential with known stop loss
Plan entries and position sizing safely
Clearly visualize safe leverage per candle
Simple, efficient, and educational
Disclaimer:
The indicator does not execute trades automatically and is not a full trading system. It is intended solely for educational purposes and safe leverage management.
This indicator uses a single selectable moving average (SMA, EMA, WMA, HMA, or VWMA) to calculate safe leverage per candle, allowing traders to maximize each trade within a defined stop loss. Actual profit remains variable depending on market movement and applied leverage.
How signals appear and how leverage is determined
L (green): signals that price crossed above the moving average (potential long entry).
S (red): signals that price crossed below the moving average (potential short entry).
Each crossover shows a label with “x”, indicating the theoretical safe leverage for that candle.
How safe leverage is calculated:
Long: close ÷ (close − candle low)
Short: close ÷ (candle high − close)
How leverage is applied:
Identify the signal candle and record close, high, and low.
Calculate the difference between the close price and the stop price (low for Long, high for Short).
The percentage difference between these prices is our safe leverage: the smaller the difference, the higher the leverage possible, always respecting the stop loss.
The “x” label shows this maximum leverage, protecting the position balance using the candle’s stop loss.
Actual profit will still depend on market movement, but the stop loss is already defined and secure.
Main benefits:
Maximize trade potential with known stop loss
Plan entries and position sizing safely
Clearly visualize safe leverage per candle
Simple, efficient, and educational
Disclaimer:
The indicator does not execute trades automatically and is not a full trading system. It is intended solely for educational purposes and safe leverage management.
开源脚本
秉承TradingView的精神,该脚本的作者将其开源,以便交易者可以查看和验证其功能。向作者致敬!您可以免费使用该脚本,但请记住,重新发布代码须遵守我们的网站规则。
免责声明
这些信息和出版物并非旨在提供,也不构成TradingView提供或认可的任何形式的财务、投资、交易或其他类型的建议或推荐。请阅读使用条款了解更多信息。
开源脚本
秉承TradingView的精神,该脚本的作者将其开源,以便交易者可以查看和验证其功能。向作者致敬!您可以免费使用该脚本,但请记住,重新发布代码须遵守我们的网站规则。
免责声明
这些信息和出版物并非旨在提供,也不构成TradingView提供或认可的任何形式的财务、投资、交易或其他类型的建议或推荐。请阅读使用条款了解更多信息。