OPEN-SOURCE SCRIPT
ATR Trend & Chop Dashboard (Overlay)
# ATR Trend & Chop Dashboard (Overlay)
**Version:** 3
**Script Type:** Overlay (Dashboard)
**Pine Script Version:** v6
---
## SUMMARY
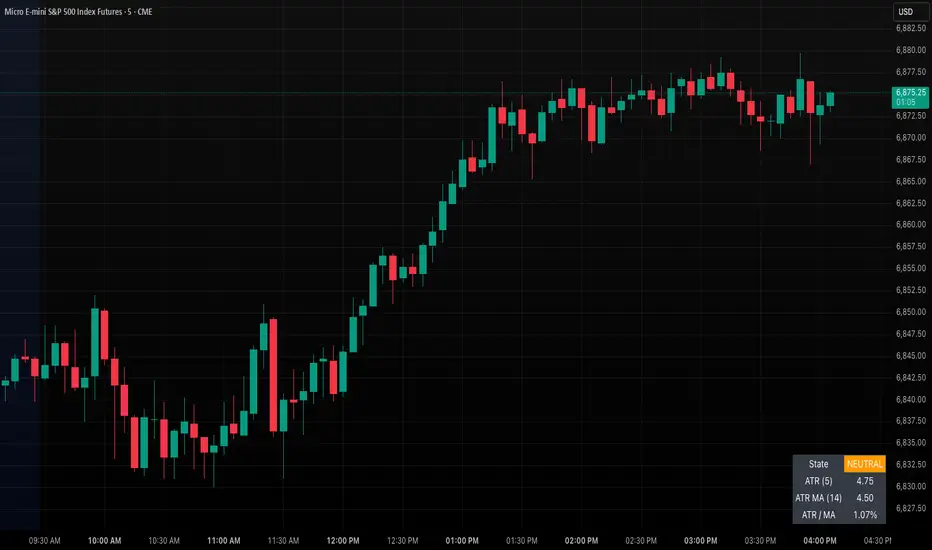
The ATR Trend & Chop Dashboard identifies volatility regimes and directional bias directly on the active chart. It combines ATR expansion and contraction behavior with EMA slope detection to help traders determine whether the market is trending, neutral, or choppy.
This version is designed for clarity and precision, with background colors disabled by default for clean chart visibility. A live dashboard displays the current state, ATR values, and ratio data in real time.
---
## FUNCTION
The indicator measures volatility and direction using two main components:
1. **ATR Regime Detection**
Calculates the ratio between the current ATR and its smoothed average (SMA of ATR).
- When the ATR expands beyond the upper threshold, volatility is considered trending.
- When it contracts below the lower threshold, the market is entering compression or chop.
2. **Directional Filter (EMA Slope)**
Measures the slope of a 50-period EMA across a short lookback window to confirm meaningful directional bias.
The ATR regime is validated only when the EMA slope supports trend direction.
3. **Classification**
- **TREND:** ATR expanded and EMA showing directional slope.
- **CHOP:** ATR suppressed and EMA showing minimal slope.
- **NEUTRAL:** Conditions between those thresholds.
---
## LOGIC
| Condition | Description |
|------------|-------------|
| TREND | Volatility expanded and direction confirmed by EMA slope. |
| CHOP | Volatility compressed with no strong directional structure. |
| NEUTRAL | Transitional condition near baseline ratio. |
The script dynamically adapts across instruments and timeframes.
---
## INPUTS
**Core Settings**
- ATR timeframe (default: 5-minute, adjustable to any timeframe).
- ATR length and smoothing period (SMA length).
- Trend threshold (ratio above/below 1.0).
**Directional Filter**
- EMA length (default: 50).
- Slope lookback (default: 3 bars).
- Minimum EMA slope as a fraction of ATR (default: 0.05).
**Visual Options**
- Show background colors (off by default).
- Dashboard position (Top Left, Top Right, Bottom Left, Bottom Right).
- Show status label (optional on-chart tag with current ATR timeframe and state).
---
## HOW TO USE
1. Apply the indicator to the timeframe where you plan to analyze entries and exits.
The default ATR timeframe is **5-minute**, but it can be changed in settings to match your preferred analysis timeframe.
2. Use the dashboard and background color states as environmental filters:
- TREND = Favor continuation or breakout strategies.
- CHOP = Favor mean reversion or avoid overtrading.
- NEUTRAL = Transition zone; remain patient or reduce size.
3. Combine the dashboard signals with VWAP, EMA crossovers, or ORB range tools for confirmation and higher confluence.
---
## ALERTS
The following alerts are available for automation or visual triggers:
- ATR TREND Regime
- ATR CHOP Regime
- ATR NEUTRAL Regime
Each alert provides clear notification when volatility or structure changes.
---
## COMPLIANCE NOTES
- Background colors are disabled by default to maintain chart readability.
- Default ATR timeframe is **5-minute**, but this value can be modified in the inputs menu.
- The script’s logic is original and built specifically to merge ATR-driven volatility structure with directional slope context in a single overlay.
- Description provided here meets TradingView’s publication rules for clarity, purpose, originality, and instructional detail.
---
**Version:** 3
**Script Type:** Overlay (Dashboard)
**Pine Script Version:** v6
---
## SUMMARY
The ATR Trend & Chop Dashboard identifies volatility regimes and directional bias directly on the active chart. It combines ATR expansion and contraction behavior with EMA slope detection to help traders determine whether the market is trending, neutral, or choppy.
This version is designed for clarity and precision, with background colors disabled by default for clean chart visibility. A live dashboard displays the current state, ATR values, and ratio data in real time.
---
## FUNCTION
The indicator measures volatility and direction using two main components:
1. **ATR Regime Detection**
Calculates the ratio between the current ATR and its smoothed average (SMA of ATR).
- When the ATR expands beyond the upper threshold, volatility is considered trending.
- When it contracts below the lower threshold, the market is entering compression or chop.
2. **Directional Filter (EMA Slope)**
Measures the slope of a 50-period EMA across a short lookback window to confirm meaningful directional bias.
The ATR regime is validated only when the EMA slope supports trend direction.
3. **Classification**
- **TREND:** ATR expanded and EMA showing directional slope.
- **CHOP:** ATR suppressed and EMA showing minimal slope.
- **NEUTRAL:** Conditions between those thresholds.
---
## LOGIC
| Condition | Description |
|------------|-------------|
| TREND | Volatility expanded and direction confirmed by EMA slope. |
| CHOP | Volatility compressed with no strong directional structure. |
| NEUTRAL | Transitional condition near baseline ratio. |
The script dynamically adapts across instruments and timeframes.
---
## INPUTS
**Core Settings**
- ATR timeframe (default: 5-minute, adjustable to any timeframe).
- ATR length and smoothing period (SMA length).
- Trend threshold (ratio above/below 1.0).
**Directional Filter**
- EMA length (default: 50).
- Slope lookback (default: 3 bars).
- Minimum EMA slope as a fraction of ATR (default: 0.05).
**Visual Options**
- Show background colors (off by default).
- Dashboard position (Top Left, Top Right, Bottom Left, Bottom Right).
- Show status label (optional on-chart tag with current ATR timeframe and state).
---
## HOW TO USE
1. Apply the indicator to the timeframe where you plan to analyze entries and exits.
The default ATR timeframe is **5-minute**, but it can be changed in settings to match your preferred analysis timeframe.
2. Use the dashboard and background color states as environmental filters:
- TREND = Favor continuation or breakout strategies.
- CHOP = Favor mean reversion or avoid overtrading.
- NEUTRAL = Transition zone; remain patient or reduce size.
3. Combine the dashboard signals with VWAP, EMA crossovers, or ORB range tools for confirmation and higher confluence.
---
## ALERTS
The following alerts are available for automation or visual triggers:
- ATR TREND Regime
- ATR CHOP Regime
- ATR NEUTRAL Regime
Each alert provides clear notification when volatility or structure changes.
---
## COMPLIANCE NOTES
- Background colors are disabled by default to maintain chart readability.
- Default ATR timeframe is **5-minute**, but this value can be modified in the inputs menu.
- The script’s logic is original and built specifically to merge ATR-driven volatility structure with directional slope context in a single overlay.
- Description provided here meets TradingView’s publication rules for clarity, purpose, originality, and instructional detail.
---
开源脚本
In true TradingView spirit, the creator of this script has made it open-source, so that traders can review and verify its functionality. Kudos to the author! While you can use it for free, remember that republishing the code is subject to our House Rules.
免责声明
The information and publications are not meant to be, and do not constitute, financial, investment, trading, or other types of advice or recommendations supplied or endorsed by TradingView. Read more in the Terms of Use.