OPEN-SOURCE SCRIPT
Bitcoin 50-Week MA “Cycle Line” — Bull/Bear Regime
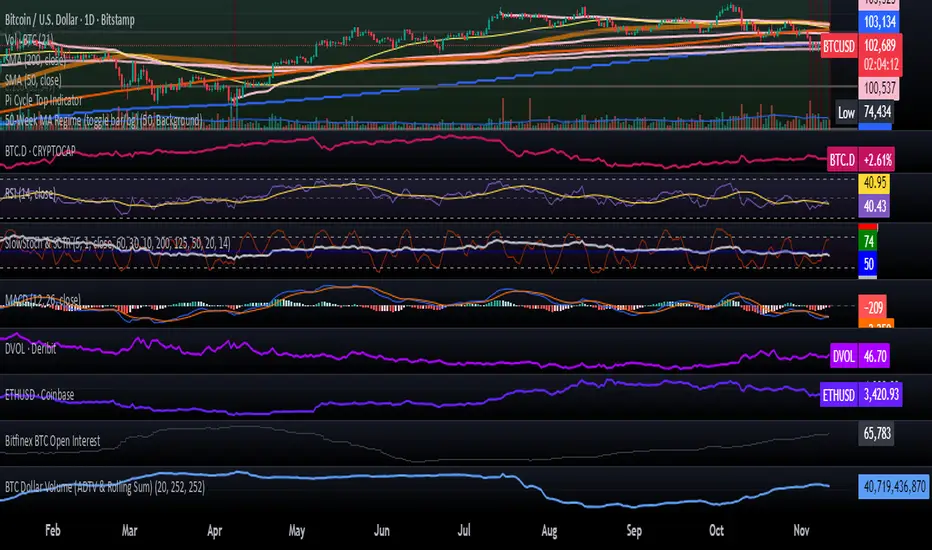
Overview. This indicator plots the true 50-week simple moving average (SMA) on any timeframe by requesting weekly data, then colors the chart to show a bull/bear regime: green when price is above the 50-week MA, red when below. Many Bitcoin analysts treat this average as a cycle “line in the sand”—multiple weekly closes below it have historically coincided with the end of bull phases and the start of broader drawdowns, while holding above has aligned with continued strength.
Why it matters. Recently, research notes and market commentary have flagged the 50-week MA near ~$100k–$103k (feed-dependent) as a critical support/resistance area to watch. Use this tool to track that threshold on your own exchange feed and timeframe.
How it works.
Pulls weekly closes via request.security() and computes a 50-week SMA (not an EMA).
Plots the line on your current chart and applies a regime color (background or candles, toggle in settings).
Works on any symbol; optimized for BTC spot and futures.
Notes.
MA values vary by data source/exchange; confirm on a weekly chart if needed.
A single intrawEEK break can whipsaw; many analysts look for confirmed weekly closes. Pair with your macro/liquidity view and risk rules.
开源脚本
In true TradingView spirit, the creator of this script has made it open-source, so that traders can review and verify its functionality. Kudos to the author! While you can use it for free, remember that republishing the code is subject to our House Rules.
免责声明
The information and publications are not meant to be, and do not constitute, financial, investment, trading, or other types of advice or recommendations supplied or endorsed by TradingView. Read more in the Terms of Use.