This TradingView indicator allows users to select a specific timeframe (TF) and then analyzes the high, low, and closing prices from the past period within that TF to calculate a central pivot point. The pivot point is determined using the formula (High + Close + Low) / 3, providing a key level around which the market is expected to pivot or change direction. In...
The Pivot Points indicator by MisterMoTA allow users to get pivots points calculated from last candle high, low and close on any timeframe from 1 minute to weekly. This will help users that are trading ins small timeframes to see the pivots that are near their timeframes and not only daily timeframe. Here is an example on the chart from nex image the timeframe...
I use this Indicator to show me where Bitcoin is heading. Most pine programmers are not aware of the possibility to combine Heikin Ashi Candles with Pivot Points that easy. You can switch between Traditional, Fibonacci, Woodie, Classic, DM, and Camarilla as usual. When on a Intraday Chart it will automaticly calculate daily Pivots for Haikin Ashi candles. On the...
Multi-Timeframe High Low Levels (@JP7FX) This Price Action indicator displays high and low levels from a selected timeframe on your current chart. These levels COULD represent areas of potential liquidity, providing key price points where traders can target entries, reversals, or continuation trades. Key Features: Display high and low levels from a...
The indicator uses a time range and another instrument for time reference, so that it works in the time zone you care about. I have set the default to SPX500USD since it is in EST ( SPX , ES and many futures are on Chicago time and opening range gets confused). You can change the reference instrument in the settings. You can also change the multipliers and use...
This script will show you at a glance the following trends: Higher Highs (Green line on top) Lower Highs (Red line on top) Higher Lows (Green line on bottom) Lower Lows (Red line on bottom) It utilizes the Pivot High and Pivot Low functions to determine if the previous pivot was higher or lower than the current pivot .
How does it work? - The indicator detects the highest and lowest price level in the last x periods every time prices advance by x periods. - From these values, retracement (0.618, 0.786) and expansion levels (1.272, 1.618, 2, 2.618, 3.14, 3.618, 4.236) are obtained. - Since the symmetrical counterpart of the retracement levels is used, there are two of each of the...
█ OVERVIEW - This script draws array-based Pivot Points with the calculated slope on the next connecting point. - The script works left to right, but could be be modified. - Looks best with Label-Style on Diamonds, without Slope Text drawn. █ Thank You! - Many more to come which will utilize these fundamentals! 🅝🅔🅒🅡🅞🅜🅐🅝🅒🅔🅡
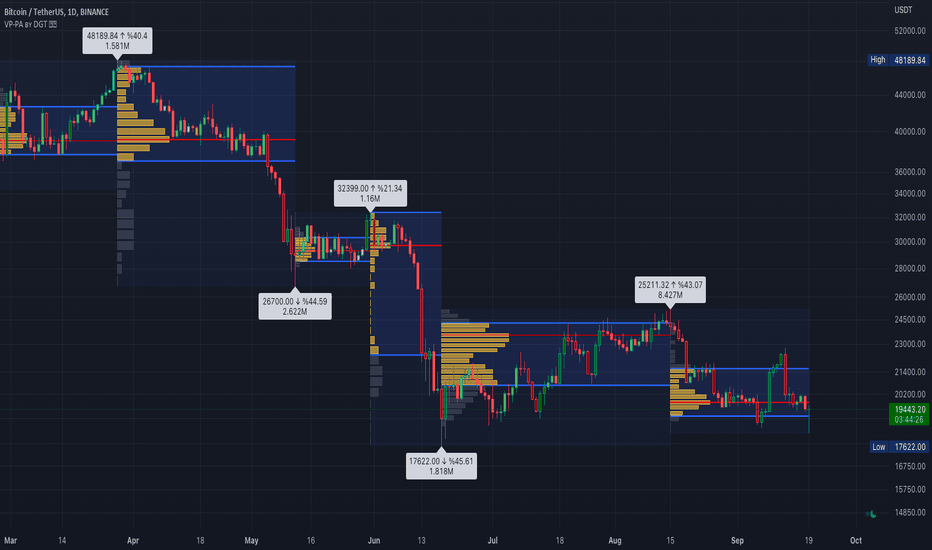
Volume Profile (also known as Price by Volume ) is an charting study that displays trading activity over a specified time period at specific price levels. It is plotted as a horizontal histogram on the finacial isntrumnet's chart that highlights the trader's interest at specific price levels. Specified time period with Pivots Anchored Volume Profile is...
I have included the main support and resistance pivot point levels for the Fibonacci Pivot Points. I changed the bar colors to reflect buy and sell points so if a bar is green then that means to buy it and if it is red then sell it Let me know if you would like to see me do any other indicators!
Adapted from Pinescript Manual's "Pivot Points Standard". Added extra levels and midlines as well as user inputs for color and a "show labels" on/off switch. So this will show the Pivot level, the resulting levels R1,R2,R3,S1,S2,S3 and the midpoint lines between these. User can choose the Higher timeframe period from which to calculate these pivot levels, as per...
Hello traders, This script is an adaption of an FXCM indicator called Pivots Cloud Takes in input two timeframes, build the pivots based on them and fill the space between those pivots Should be non-repainting Best Dave

![Pivot Points [MisterMoTA] PERPUSDT.P: Pivot Points [MisterMoTA]](https://s3.tradingview.com/l/LEDYPCEi_mid.png)


![DonchianFib[Akcay] BNBUSDT: DonchianFib[Akcay]](https://s3.tradingview.com/z/ZnuN94Y1_mid.png)


