Magnificent 7 OscillatorThe Magnificent 7 Oscillator is a sophisticated momentum-based technical indicator designed to analyze the collective performance of the seven largest technology companies in the U.S. stock market (Apple, Microsoft, Alphabet, Amazon, NVIDIA, Tesla, and Meta). This indicator incorporates established momentum factor research and provides three distinct analytical modes: absolute momentum tracking, equal-weighted market comparison, and relative performance analysis. The tool integrates five different oscillator methodologies and includes advanced breadth analysis capabilities.
Theoretical Foundation
Momentum Factor Research
The indicator's foundation rests on seminal momentum research in financial markets. Jegadeesh and Titman (1993) demonstrated that stocks with strong price performance over 3-12 month periods tend to continue outperforming in subsequent periods¹. This momentum effect was later incorporated into formal factor models by Carhart (1997), who extended the Fama-French three-factor model to include a momentum factor (UMD - Up Minus Down)².
The momentum calculation methodology follows the academic standard:
Momentum(t) = / P(t-n) × 100
Where P(t) is the current price and n is the lookback period.
The focus on the "Magnificent 7" stocks reflects the increasing market concentration observed in recent years. Fama and French (2015) noted that a small number of large-cap stocks can drive significant market movements due to their substantial index weights³. The combined market capitalization of these seven companies often exceeds 25% of the total S&P 500, making their collective momentum a critical market indicator.
Indicator Architecture
Core Components
1. Data Collection and Processing
The indicator employs robust data collection with error handling for missing or invalid security data. Each stock's momentum is calculated independently using the specified lookback period (default: 14 periods).
2. Composite Oscillator Calculation
Following Fama-French factor construction methodology, the indicator offers two weighting schemes:
- Equal Weight: Each active stock receives identical weighting (1/n)
- Market Cap Weight: Reserved for future enhancement
3. Oscillator Transformation Functions
The indicator provides five distinct oscillator types, each with established technical analysis foundations:
a) Momentum Oscillator (Default)
- Pure rate-of-change calculation
- Centered around zero
- Direct implementation of Jegadeesh & Titman methodology
b) RSI (Relative Strength Index)
- Wilder's (1978) relative strength methodology
- Transformed to center around zero for consistency
- Scale: -50 to +50
c) Stochastic Oscillator
- George Lane's %K methodology
- Measures current position within recent range
- Transformed to center around zero
d) Williams %R
- Larry Williams' range-based oscillator
- Inverse stochastic calculation
- Adjusted for zero-centered display
e) CCI (Commodity Channel Index)
- Donald Lambert's mean reversion indicator
- Measures deviation from moving average
- Scaled for optimal visualization
Operational Modes
Mode 1: Magnificent 7 Analysis
Tracks the collective momentum of the seven constituent stocks. This mode is optimal for:
- Technology sector analysis
- Growth stock momentum assessment
- Large-cap performance tracking
Mode 2: S&P 500 Equal Weight Comparison
Analyzes momentum using an equal-weighted S&P 500 reference (typically RSP ETF). This mode provides:
- Broader market momentum context
- Size-neutral market analysis
- Comparison baseline for relative performance
Mode 3: Relative Performance Analysis
Calculates the momentum differential between Magnificent 7 and S&P 500 Equal Weight. This mode enables:
- Sector rotation analysis
- Style factor assessment (Growth vs. Value)
- Relative strength identification
Formula: Relative Performance = MAG7_Momentum - SP500EW_Momentum
Signal Generation and Thresholds
Signal Classification
The indicator generates three signal states:
- Bullish: Oscillator > Upper Threshold (default: +2.0%)
- Bearish: Oscillator < Lower Threshold (default: -2.0%)
- Neutral: Oscillator between thresholds
Relative Performance Signals
In relative performance mode, specialized thresholds apply:
- Outperformance: Relative momentum > +1.0%
- Underperformance: Relative momentum < -1.0%
Alert System
Comprehensive alert conditions include:
- Threshold crossovers (bullish/bearish signals)
- Zero-line crosses (momentum direction changes)
- Relative performance shifts
- Breadth Analysis Component
The indicator incorporates market breadth analysis, calculating the percentage of constituent stocks with positive momentum. This feature provides insights into:
- Strong Breadth (>60%): Broad-based momentum
- Weak Breadth (<40%): Narrow momentum leadership
- Mixed Breadth (40-60%): Neutral momentum distribution
Visual Design and User Interface
Theme-Adaptive Display
The indicator automatically adjusts color schemes for dark and light chart themes, ensuring optimal visibility across different user preferences.
Professional Data Table
A comprehensive data table displays:
- Current oscillator value and percentage
- Active mode and oscillator type
- Signal status and strength
- Component breakdowns (in relative performance mode)
- Breadth percentage
- Active threshold levels
Custom Color Options
Users can override default colors with custom selections for:
- Neutral conditions (default: Material Blue)
- Bullish signals (default: Material Green)
- Bearish signals (default: Material Red)
Practical Applications
Portfolio Management
- Sector Allocation: Use relative performance mode to time technology sector exposure
- Risk Management: Monitor breadth deterioration as early warning signal
- Entry/Exit Timing: Utilize threshold crossovers for position sizing decisions
Market Analysis
- Trend Identification: Zero-line crosses indicate momentum regime changes
- Divergence Analysis: Compare MAG7 performance against broader market
- Volatility Assessment: Oscillator range and frequency provide volatility insights
Strategy Development
- Factor Timing: Implement growth factor timing strategies
- Momentum Strategies: Develop systematic momentum-based approaches
- Risk Parity: Use breadth metrics for risk-adjusted portfolio construction
Configuration Guidelines
Parameter Selection
- Momentum Period (5-100): Shorter periods (5-20) for tactical analysis, longer periods (50-100) for strategic assessment
- Smoothing Period (1-50): Higher values reduce noise but increase lag
- Thresholds: Adjust based on historical volatility and strategy requirements
Timeframe Considerations
- Daily Charts: Optimal for swing trading and medium-term analysis
- Weekly Charts: Suitable for long-term trend analysis
- Intraday Charts: Useful for short-term tactical decisions
Limitations and Considerations
Market Concentration Risk
The indicator's focus on seven stocks creates concentration risk. During periods of significant rotation away from large-cap technology stocks, the indicator may not represent broader market conditions.
Momentum Persistence
While momentum effects are well-documented, they are not permanent. Jegadeesh and Titman (1993) noted momentum reversal effects over longer time horizons (2-5 years).
Correlation Dynamics
During market stress, correlations among the constituent stocks may increase, reducing the diversification benefits and potentially amplifying signal intensity.
Performance Metrics and Backtesting
The indicator includes hidden plots for comprehensive backtesting:
- Individual stock momentum values
- Composite breadth percentage
- S&P 500 Equal Weight momentum
- Relative performance calculations
These metrics enable quantitative strategy development and historical performance analysis.
References
¹Jegadeesh, N., & Titman, S. (1993). Returns to buying winners and selling losers: Implications for stock market efficiency. Journal of Finance, 48(1), 65-91.
Carhart, M. M. (1997). On persistence in mutual fund performance. Journal of Finance, 52(1), 57-82.
Fama, E. F., & French, K. R. (2015). A five-factor asset pricing model. Journal of Financial Economics, 116(1), 1-22.
Wilder, J. W. (1978). New concepts in technical trading systems. Trend Research.
在脚本中搜索"momentum"

Session-Based Sentiment Oscillator [TradeDots]Track, analyze, and monitor market sentiment across global trading sessions with this advanced multi-session sentiment analysis tool. This script provides session-specific sentiment readings for Asian (Tokyo), European (London), and US (New York) markets, combining price action, volume analysis, and volatility factors into a comprehensive sentiment oscillator. It is an original indicator designed to help traders understand regional market psychology and capitalize on cross-session sentiment shifts directly on TradingView.
📝 HOW IT WORKS
1. Multi-Component Sentiment Engine
Price Action Momentum : Calculates normalized price movement relative to recent trading ranges, providing directional sentiment readings.
Volume-Weighted Analysis : When volume data is available, incorporates volume flow direction to validate price-based sentiment signals.
Volatility-Adjusted Factors : Accounts for changing market volatility conditions by comparing current ATR against historical averages.
Weighted Combination : Merges all components using optimized weightings (Price: 1.0, Volume: 0.3, Volatility: 0.2) for balanced sentiment readings.
2. Session-Segregated Tracking
Automatic Session Detection : Precisely identifies active trading sessions based on user-configured time parameters.
Independent Calculations : Maintains separate sentiment accumulation for each major session, updated only during respective active hours.
Historical Preservation : Stores session-specific sentiment values even when sessions are closed, enabling cross-session comparison.
Real-Time Updates : Continuously processes sentiment during active sessions while preserving inactive session data.
3. Cross-Session Transition Analysis
Sentiment Differential Detection : Monitors sentiment changes when transitioning between trading sessions.
Configurable Thresholds : Generates signals only when sentiment shifts exceed user-defined minimum thresholds.
Directional Signals : Provides distinct bullish and bearish transition alerts with visual markers.
Smart Filtering : Applies smoothing algorithms to reduce false signals from minor sentiment variations.
⚙️ KEY FEATURES
1. Session-Specific Dashboard
Real-Time Status Display : Shows current session activity (ACTIVE/CLOSED) for all three major sessions.
Sentiment Percentages : Displays precise sentiment readings as percentages for easy interpretation.
Strength Classification : Automatically categorizes sentiment as HIGH (>50%), MEDIUM (20-50%), or LOW (<20%).
Customizable Positioning : Place dashboard in any corner with adjustable size options.
2. Advanced Signal Generation
Transition Alerts : Triangle markers indicate significant sentiment shifts between sessions.
Extreme Conditions : Diamond markers highlight overbought/oversold threshold breaches.
Configurable Sensitivity : Adjust signal thresholds from 0.05 to 0.50 based on trading style.
Alert Integration : Built-in TradingView alert conditions for automated notifications.
3. Forex Currency Strength Analysis
Base/Quote Decomposition : For forex pairs, separates sentiment into individual currency strength components.
Major Currency Support : Analyzes USD, EUR, GBP, JPY, CHF, CAD, AUD, NZD strength relationships.
Relative Strength Display : Shows which currency is driving pair movement during active sessions.
4. Visual Enhancement System
Session Background Colors : Distinct background shading for each active trading session.
Overbought/Oversold Zones : Configurable extreme sentiment level visualization with colored zones.
Multi-Timeframe Compatibility : Works across all timeframes while maintaining session accuracy.
Customizable Color Schemes : Full color customization for dashboard, signals, and plot elements.
🚀 HOW TO USE IT
1. Add the Script
Search for "Session-Based Sentiment Oscillator " in the Indicators tab or manually add it to your chart. The indicator will appear in a separate pane below your main chart.
2. Configure Session Times
Asian Session : Set Tokyo market hours (default: 00:00-09:00) based on your chart timezone.
European Session : Configure London market hours (default: 07:00-16:00) for European analysis.
US Session : Define New York market hours (default: 13:00-22:00) for American markets.
Timezone Adjustment : Ensure session times match your broker's specifications and account for daylight saving changes.
3. Optimize Analysis Parameters
Sentiment Period : Choose 5-50 bars (default: 14) for sentiment calculation lookback period.
Smoothing Settings : Select 1-10 bars smoothing (default: 3) with SMA, EMA, or RMA options.
Component Selection : Enable/disable volume analysis, price action, and volatility factors based on available data.
Signal Sensitivity : Adjust threshold from 0.05-0.50 (default: 0.15) for transition signal generation.
4. Interpret Readings and Signals
Positive Values : Indicate bullish sentiment for the active session.
Negative Values : Suggest bearish sentiment conditions.
Dashboard Status : Monitor which session is currently active and their respective sentiment strengths.
Transition Signals : Watch for triangle markers indicating significant cross-session sentiment changes.
Extreme Alerts : Note diamond markers when sentiment reaches overbought (>70%) or oversold (<-70%) levels.
5. Set Up Alerts
Configure TradingView alerts for:
- Bullish session transitions
- Bearish session transitions
- Overbought condition alerts
- Oversold condition alerts
❗️LIMITATIONS
1. Data Dependency
Volume Requirements : Volume-based analysis only functions when volume data is provided by your broker. Many forex brokers do not supply reliable volume data.
Price Action Focus : In absence of volume data, sentiment calculations rely primarily on price movement and volatility factors.
2. Session Time Sensitivity
Manual Adjustment Required : Session times must be manually updated for daylight saving time changes.
Broker Variations : Different brokers may have slightly different session definitions requiring time parameter adjustments.
3. Ranging Market Limitations
Trend Bias : Sentiment calculations may be less reliable during extended sideways or low-volatility market conditions.
Lag Consideration : As with all sentiment indicators, readings may lag during rapid market transitions.
4. Regional Market Focus
Major Session Coverage : Designed primarily for major global sessions; may not capture sentiment from smaller regional markets.
Weekend Gaps : Does not account for weekend gap effects on sentiment calculations.
⚠️ RISK DISCLAIMER
Trading and investing carry significant risk and can result in financial loss. The "Session-Based Sentiment Oscillator " is provided for informational and educational purposes only. It does not constitute financial advice.
- Always conduct your own research and analysis
- Use proper risk management and position sizing in all trades
- Past sentiment patterns do not guarantee future market behavior
- Combine this indicator with other technical and fundamental analysis tools
- Consider overall market context and your personal risk tolerance
This script is an original creation by TradeDots, published under the Mozilla Public License 2.0.
Session-based sentiment analysis should be used as part of a comprehensive trading strategy. No single indicator can predict market movements with certainty. Exercise proper risk management and maintain realistic expectations about indicator performance across varying market conditions.

US Growth Momentum Index (UGMI)US Growth Momentum Index (UGMI) is a macroeconomic indicator designed to reflect the current economic health of the United States. The index combines four key economic factors—Industrial Production (INDPRO), Retail Sales (RSAFS), Unemployment Rate (UNRATE), and the 10Y-2Y Yield Curve Spread—and aggregates them into a single line representing overall growth momentum.
The UGMI is based on Z-Score calculations for each of these components, helping to identify whether the U.S. economy is in an expansionary growth phase or a contractionary recession phase.
How to Read the UGMI:
Core Growth Line (Blue): This is the main line representing the aggregated growth momentum. It is calculated using the Z-scores of the key economic indicators.
0 Line: The 0 line represents the neutral zone. If the UGMI is above the 0 line, it suggests that the economy is expanding. Below the 0 line indicates contraction or a potential recession.
Zones Above 1: When the UGMI is above 1, it represents a strong expansionary phase or boom, possibly signaling the top of a bull market or local peak.
Zones Below -1: When the UGMI falls below -1, it indicates a severe recession or significant contraction in the economy.
Color Coding:
Green: When the UGMI is above the 1 line, the background turns green, indicating a strong growth phase.
Red: When the UGMI is below -1, the background turns red, representing a recession or significant economic downturn.
This indicator helps traders and investors to understand whether the economy is growing or contracting, and is especially useful for identifying potential market tops or turning points.

Dual Momentum OSCOverview:
Momentum OSC is a dual-layered momentum oscillator that blends multi-timeframe momentum readings with moving average crossovers for deeper insight into trend acceleration and exhaustion. Perfect for confirming trend strength or spotting early shifts in momentum.
Features:
✅ Two separate momentum streams with customizable timeframes
✅ Smoothing via moving averages for both momenta
✅ Cross-timeframe momentum structure for confirmation and divergence
✅ Color-coded areas for intuitive visual interpretation
✅ Optional crossover markers to signal bullish/bearish momentum shifts
How It Works:
The script calculates two momentum values by comparing current price sources against lagged values across separate timeframes. Each is smoothed with a moving average to filter noise. The difference between momentum and its moving average forms a core component of trend strength confirmation. Optional visual circles mark bullish or bearish crossovers.
Customizable Inputs:
Timeframes, sources, lengths, and MA periods for both momentum streams
Toggle to display momentum cross signals (circles)
Works on any asset or timeframe

Adaptable Relative Momentum Index [ParadoxAlgo]The Adaptable Relative Momentum Index (RMI) by ParadoxAlgo is an advanced momentum-based indicator that builds upon the well-known RSI (Relative Strength Index) concept by introducing a customizable momentum length. This indicator measures price momentum over a specified number of periods and applies a Rolling Moving Average (RMA) to both the positive and negative price changes. The result is a versatile tool that can help traders gauge the strength of a trend, pinpoint overbought/oversold levels, and potentially identify breakout opportunities.
⸻
Smart Configuration Feature
What sets this version of the RMI apart is ParadoxAlgo’s exclusive “Smart Configuration” functionality. Instead of manually adjusting parameters, traders can simply select their Asset Class (e.g., Stocks, Forex, Futures/Indices, Crypto, Commodities) and Trading Style (e.g., Scalping, Day Trading, Swing Trading, Short-Term Investing, Long-Term Investing). Based on these selections, the indicator automatically optimizes its core parameters:
• Length – The period over which the price changes are smoothed.
• Momentum Length – The number of bars used to calculate the price change.
By automating this process, users save time on tedious trial-and-error adjustments, ensuring that the RMI’s settings are tailored to the characteristics of specific markets and personal trading horizons.
⸻
Key Features & Benefits
1. Momentum-Based Insights
• Uses RMA to smooth price movements, helping identify shifts in market momentum more clearly than a basic RSI.
• Enhanced adaptability for a wide range of asset classes and time horizons.
2. Simple Yet Powerful Configuration
• Smart Configuration automatically sets optimal parameter values for each combination of asset class and trading style.
• Eliminates guesswork and manual recalibration when switching between markets or timeframes.
3. Overbought & Oversold Visualization
• Integrated highlight zones mark potential overbought and oversold extremes (default at 80 and 20).
• Optional breakout highlighting draws attention to times when the indicator crosses these key thresholds, helping spot possible entry or exit signals.
4. Intuitive Design & Ease of Use
• Clean plotting and color-coded signal lines make it easy to interpret bullish or bearish shifts in momentum.
• Straightforward dropdown menus keep the interface user-friendly, even for novice traders.
⸻
Practical Applications
• Early Trend Detection: Spot emerging trends when the RMI transitions from oversold to higher levels or vice versa.
• Breakout Confirmation: Confirm potential breakout trades by tracking overbought/oversold breakouts alongside other technical signals.
• Support/Resistance Confluence: Combine RMI signals with horizontal support/resistance levels to reinforce trade decisions.
• Trade Timing: Quickly gauge when momentum could be shifting, helping you time entries and exits more effectively.
⸻
Disclaimer
As with any technical indicator, the Adaptable Relative Momentum Index should be used as part of a broader trading strategy that includes risk management, fundamental analysis, and other forms of technical confirmation. Past performance does not guarantee future results.
⸻
Enjoy using the Adaptable RMI and experience a more streamlined, flexible approach to momentum analysis. Feel free to explore different asset classes and trading styles to discover which configurations resonate best with your unique trading preferences.

ORB with Alerts - Current Day OnlyORB with Alerts - Current Day Only
This script plots the Opening Range Breakout (ORB) levels and provides alerts when price breaks above or below the range. It is designed for intraday trading and resets daily.
How It Works:
The ORB time in settings should be set to 15 minutes.
The Session Time should be set to 09:30 - 09:45.
The script marks the high and low of the ORB period and tracks price action for breakouts.
Alerts trigger when price crosses above the ORB high or below the ORB low.
This tool helps traders identify breakout opportunities based on early price action, aiding in momentum-based strategies
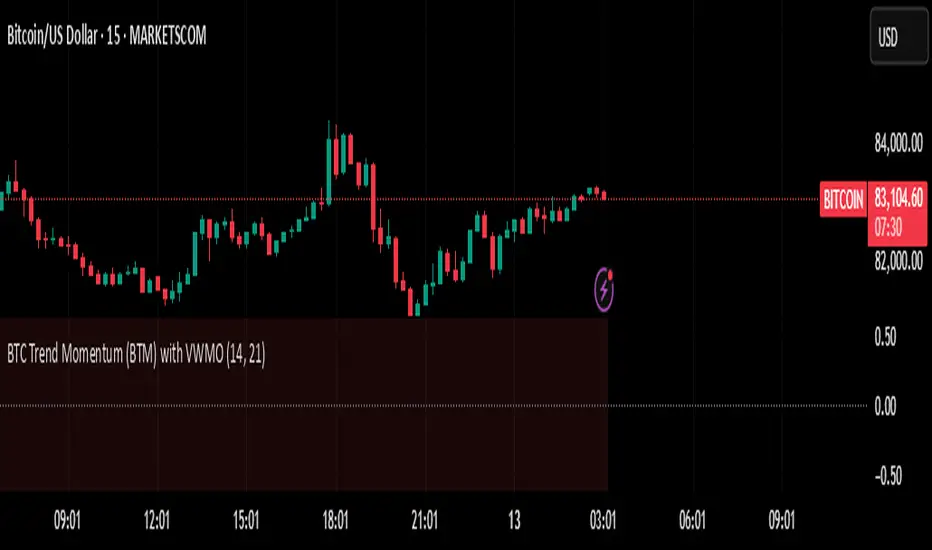
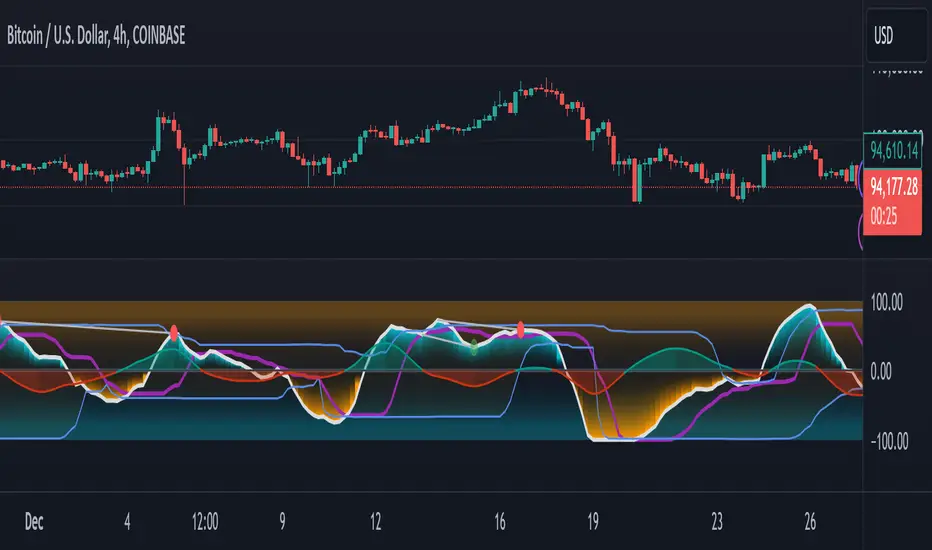
BTC Trend Momentum (BTM) with VWMOBTC Trend Momentum (BTM) with VWMO – A Smarter Way to Trade Bitcoin 🚀
Overview
Bitcoin price movements can be volatile, often leading to fake breakouts and whipsaws that mislead traders. BTC Trend Momentum (BTM), combined with Volume Weighted Moving Average (VWMO), helps smooth out market noise and provide clearer trend signals.
This script integrates momentum analysis, trend strength detection, and zero-line crossovers, allowing traders to make smarter entries and exits while avoiding false signals.
⸻
Why Use This Indicator?
✅ Momentum Histogram – Easily visualize trend strength with color-coded bars.
✅ Volume-Weighted Analysis – Uses VWMO to filter out weak price movements.
✅ Zero Line Crossover Alerts – Identifies major trend shifts in real-time.
✅ Dynamic Color Coding – Stronger trends highlighted in brighter colors.
✅ Background Shading – Differentiates bullish & bearish zones for easy trend reading.
✅ Built-in Alerts – Get notified of trade opportunities instantly.
⸻
How to Trade Using BTC Trend Momentum (BTM)
🔹 Buy Signal: When the momentum histogram (green bars) crosses above the EMA (orange line).
🔹 Sell Signal: When the momentum histogram (red bars) crosses below the EMA.
🔹 Strong Trend Confirmation: If histogram bars turn lime (bullish) or maroon (bearish), it indicates strong momentum.
🔹 Zero Line Crossovers: A bullish crossover above zero confirms an uptrend, while a bearish crossover below zero confirms a downtrend.
For better results, combine with RSI, MACD, or VWAP to confirm trend strength before entering trades.
⸻
Best Timeframes for Trading
📌 1H & 4H – Ideal for swing trading Bitcoin.
📌 5M & 15M – Perfect for scalping BTC with precision.
⸻
💡 Would you integrate BTC Trend Momentum (BTM) into your trading strategy? Let us know your thoughts below!
Uptrick: Time Based ReversionIntroduction
The Uptrick: Time Based Reversion indicator is designed to provide a comprehensive view of market momentum and potential trend shifts by combining multiple moving averages, a streak-based trend analysis system, and adaptive color visualization. It helps traders identify strong trends, spot potential reversals, and make more informed trading decisions.
Purpose
The primary goal of this indicator is to assist traders in distinguishing between sustained market movements and short-lived fluctuations. By evaluating how price behaves relative to its moving averages, and by measuring consecutive streaks above or below these averages, the indicator highlights areas where trends are likely to continue or lose momentum.
Overview
Uptrick: Time Based Reversion calculates one or more moving averages of price data and then tracks the number of consecutive bars (streaks) above or below these averages. This streak-based detection provides insight into whether a trend is gaining strength or nearing a potential reversal point. The indicator offers:
• Multiple moving average types (SMA, EMA, WMA)
• Optional second and third moving average layers for additional smoothing of first moving average
• A streak detection system to quantify trend intensity
• A dynamic color scheme that changes with streak strength
• Optional buy and sell signals for potential trade entries and exits
• A ribbon mode that applies moving averages to Open, High, Low, and Close prices for a more detailed visualization of overall trend alignment
Originality and Uniqueness
Unlike traditional moving average indicators, Uptrick: Time Based Reversion incorporates a streak measurement system to detect trend strength. This approach helps clarify whether a price movement is merely a quick fluctuation or part of a longer-lasting trend. Additionally, the optional ribbon mode extends this logic to Open, High, Low, and Close prices, creating a layered and intuitive visualization that shows complete trend alignment.
Inputs and Features
1. Enable Ribbon Mode
This input lets you activate or deactivate the ribbon display of multiple moving averages. When enabled, the script plots moving averages for the Open, High, Low, and Close prices and uses color fills to show whether these four data points are collectively above or below their respective moving averages.
2. Color Scheme Selection
Users can choose from several predefined color schemes, such as Default, Emerald, Crimson, Sapphire, Gold, Purple, Teal, Orange, Gray, Lime, or Aqua. Each scheme assigns distinct bullish, bearish and neutral colors..
3. Show Buy/Sell Signals
The indicator can display buy or sell signals based on its streak analysis logic. These signals appear as markers on the chart, indicating a “Safe Uptrend” (buy) or “Safe Downtrend” (sell).
4. Moving Average Types and Lengths
• First MA Type and Length: Choose SMA, EMA, or WMA along with a customizable period.
• Second and Third MA Types and Lengths: You can optionally stack additional moving averages for further smoothing, each with its own customizable type and period.
5. Streak Threshold Multiplier
This numeric input determines how strong a streak must be before the script considers it a “safe” trend. A higher multiplier requires a longer or more intense streak for a buy or sell signal.
6. Dynamic Transparency Calculation
The color intensity adapts to the streak’s strength. Longer streaks increase the transparency of the opposing color, making the current dominant color stand out. This feature ensures that a vigorous uptrend or downtrend is visually distinct from short-lived or weaker moves.
7. Ribbon Moving Averages
In ribbon mode, the script calculates moving averages for the Open, High, Low, and Close prices. Each of these is optionally smoothed again if the second and/or third moving average layers are active. The final result is a ribbon of moving averages that helps confirm whether the market is uniformly aligned above or below these key reference points.
Calculation Methodology
1. Initial Moving Average
The script calculates the first moving average (SMA, EMA, or WMA) of the closing price over a user-defined period.
2. Optional Secondary and Tertiary Averages
If selected, the script then applies a second and/or third smoothing step. Each of these steps can be a different type of moving average (SMA, EMA, or WMA) with its own period length.
3. Streak Detection
The indicator counts consecutive bars above or below the smoothed moving average. A running total (streakUp or streakDown) increments with every bar that remains above or below that average.
4. Reversion Intensity
The script compares the current streak value to its own average (calculated over the final chosen period). This ratio determines whether the streak is nearing a likely reversion or is strong enough to continue.
5. Color Assignment and Signals
The indicator calculates color transparency based on streak intensity. Buy and sell signals appear when the streak meets or exceeds the threshold multiplier, indicating a safe uptrend or downtrend.
Color Schemes and Visualization
This indicator offers multiple predefined color sets. Each scheme specifies a unique bullish color, bearish color and neutral color. The script automatically varies transparency to highlight strong trends and fade weaker ones, making it visually clear when a trend is intensifying or losing momentum.
Smoothing Techniques
By allowing up to three layers of moving average smoothing, the indicator accommodates different trading styles. A single layer provides faster reactions to market changes, while more layers reduce noise at the cost of slower responsiveness. Traders can choose the right balance between responsiveness and stability for their strategy, whether it is short-term scalping or long-term trend following.
Why It Combines Specific Smoothing Techniques
The Uptrick: Time Based Reversion indicator strategically combines specific smoothing techniques—SMA, EMA, and WMA—to leverage their complementary strengths. The SMA provides stable and consistent trend identification by equally weighting all data points, while the EMA emphasizes recent price movements, allowing quicker responses to market changes. WMA enhances sensitivity to recent price shifts, which helps in detecting subtle momentum changes early. By integrating these methods in layers, the indicator effectively balances responsiveness with stability, helping traders clearly identify genuine trend changes while filtering out short-term noise and false signals.
Ribbon Mode
If Open, High, Low, and Close prices remain above or below their respective moving averages consistently, the script colors the bars fully bullish or bearish. When the data points are mixed, a neutral color is applied. This mode provides a thorough perspective on whether the entire price range is aligned in one direction or showing conflicting signals.
Summary
Uptrick: Time Based Reversion combines multiple moving averages, streak detection, and dynamic color adjustments to help traders identify significant trends and potential reversal areas. Its flexibility allows it to be used either in a simpler form, with one moving average and streak analysis, or in a more advanced configuration with ribbon mode that charts multiple smoothed averages for a deeper understanding of price alignment. By adapting color intensities based on streak strength and providing optional buy/sell signals, this indicator delivers a clear and flexible tool suited to various trading strategies.
Disclaimer
This indicator is designed as an analysis aid and does not guarantee profitable trades. Past performance does not indicate future success, and market conditions can change unexpectedly. Users are advised to employ proper risk management and thoroughly evaluate trades before taking positions. Use this indicator as part of a broader strategy, not as a sole decision-making tool.

Volatility-Adjusted Momentum Oscillator (VAMO)Concept & Rationale: This indicator combines momentum and volatility into one oscillator. The idea is that a price move accompanied by high volatility has greater significance. We use Rate of Change (ROC) for momentum and Average True Range (ATR) for volatility, multiplying them to gauge “volatility-weighted momentum.” This concept is inspired by the Weighted Momentum & Volatility Indicator, which multiplies normalized ROC and ATR values. The result is shown as a histogram oscillating around zero – rising green bars indicate bullish momentum, while falling red bars indicate bearish momentum. When the histogram crosses above or below zero, it provides clear buy/sell signals. Higher magnitude bars suggest a stronger trend move. Crypto markets often see volatility spikes preceding big moves, so VAMO aims to capture those moments when momentum and volatility align for a powerful breakout.
Key Features:
Momentum-Volatility Fusion: Measures momentum (price ROC) adjusted by volatility (ATR). Strong trends register prominently only when price change is significant and volatility is elevated.
Intuitive Histogram: Plotted as a color-coded histogram around a zero line – green bars above zero for bullish trends, red bars below zero for bearish. This makes it easy to visualize trend strength and direction at a glance.
Clear Signals: A cross above 0 signals a buy, and below 0 signals a sell. Traders can also watch for the histogram peaking and then shrinking as an early sign of a trend reversal (e.g. bars switching from growing to shrinking while still positive could mean bullish momentum is waning).
Optimized for Volatility: Because ATR is built-in, the oscillator naturally adapts to crypto volatility. In calm periods, signals will be smaller (reducing noise), whereas during volatile swings the indicator accentuates the move, helping predict big price swings.
Customization: The lookback period is adjustable. Shorter periods (e.g. 5-10) make it more sensitive for scalping, while longer periods (20+) smooth it out for swing trading.
How to Use: When VAMO bars turn green and push above zero, it indicates bullish momentum with strong volatility – a cue that price is likely to rally in the near term. Conversely, red bars below zero signal bearish pressure. For example, if a coin’s price has been flat and then VAMO spikes green above zero, it suggests an explosive upward move is brewing. Traders can enter on the zero-line cross (or on the first green bar) and consider exiting when the histogram peaks and starts shrinking (signaling momentum slowdown). In sideways markets, VAMO will hover near zero – staying out during those low-volatility periods helps avoid false signals. This indicator’s strength is catching the moment when a quiet market turns volatile in one direction, which often precedes the next few candlesticks of sustained movement.

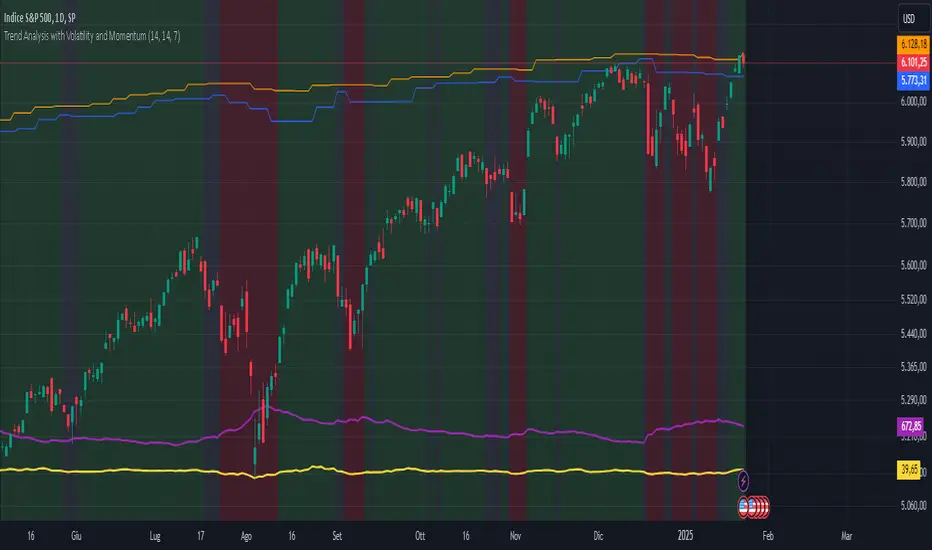
Trend Analysis with Volatility and MomentumVolatility and Momentum Trend Analyzer
The Volatility and Momentum Trend Analyzer is a multi-faceted TradingView indicator designed to provide a comprehensive analysis of market trends, volatility, and momentum. It incorporates key features to identify trend direction (uptrend, downtrend, or sideways), visualize weekly support and resistance levels, and offer a detailed assessment of market strength and activity. Below is a breakdown of its functionality:
1. Input Parameters
The indicator provides customizable settings for precision and adaptability:
Volatility Lookback Period: Configurable period (default: 14) for calculating Average True Range (ATR), which measures market volatility.
Momentum Lookback Period: Configurable period (default: 14) for calculating the Rate of Change (ROC), which measures the speed and strength of price movements.
Support/Resistance Lookback Period: Configurable period (default: 7 weeks) to determine critical support and resistance levels based on weekly high and low prices.
2. Volatility Analysis (ATR)
The Average True Range (ATR) is calculated to quantify the market's volatility:
What It Does: ATR measures the average range of price movement over the specified lookback period.
Visualization: Plotted as a purple line in a separate panel below the price chart, with values amplified (multiplied by 10) for better visibility.
3. Momentum Analysis (ROC)
The Rate of Change (ROC) evaluates the momentum of price movements:
What It Does: ROC calculates the percentage change in closing prices over the specified lookback period, indicating the strength and direction of market moves.
Visualization: Plotted as a yellow line in a separate panel below the price chart, with values amplified (multiplied by 10) for better visibility.
4. Trend Detection
The indicator identifies the current market trend based on momentum and the position of the price relative to its moving average:
Uptrend: Occurs when momentum is positive, and the closing price is above the simple moving average (SMA) of the specified lookback period.
Downtrend: Occurs when momentum is negative, and the closing price is below the SMA.
Sideways Trend: Occurs when neither of the above conditions is met.
Visualization: The background of the price chart changes color to reflect the detected trend:
Green: Uptrend.
Red: Downtrend.
Gray: Sideways trend.
5. Weekly Support and Resistance
Critical levels are calculated based on weekly high and low prices:
Support: The lowest price observed over the last specified number of weeks.
Resistance: The highest price observed over the last specified number of weeks.
Visualization:
Blue Line: Indicates the support level.
Orange Line: Indicates the resistance level.
Both lines are displayed on the main price chart, dynamically updating as new data becomes available.
6. Alerts
The indicator provides configurable alerts for trend changes, helping traders stay informed without constant monitoring:
Uptrend Alert: Notifies when the market enters an uptrend.
Downtrend Alert: Notifies when the market enters a downtrend.
Sideways Alert: Notifies when the market moves sideways.
7. Key Use Cases
Trend Following: Identify and follow the dominant trend to capitalize on sustained price movements.
Volatility Assessment: Measure market activity to determine potential breakouts or quiet consolidation phases.
Support and Resistance: Highlight key levels where price is likely to react, assisting in decision-making for entries, exits, or stop-loss placement.
Momentum Tracking: Gauge the strength and speed of price moves to validate trends or anticipate reversals.
8. Visualization Summary
Main Chart:
Background color-coded for trend direction (green, red, gray).
Blue and orange lines for weekly support and resistance.
Lower Panels:
Purple line for volatility (ATR).
Yellow line for momentum (ROC).
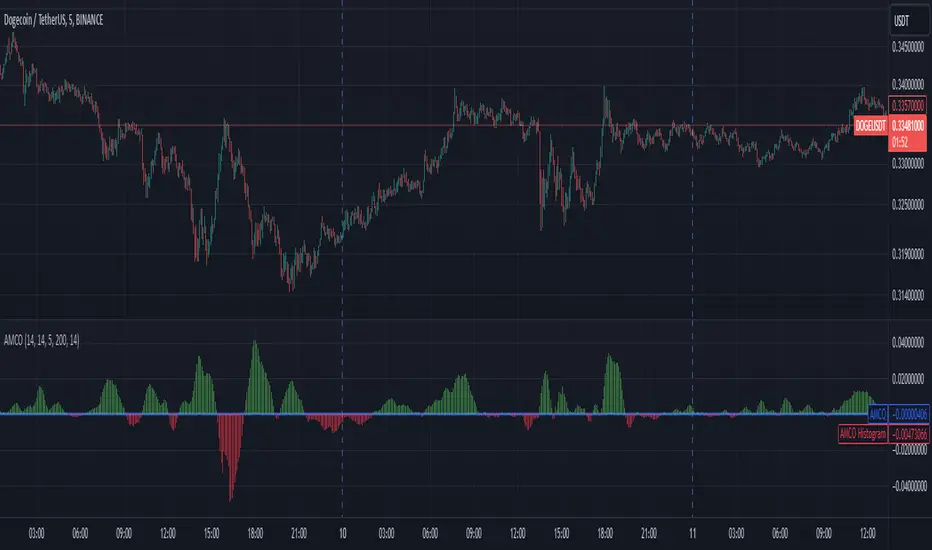
Adaptive Momentum Cycle Oscillator (AMCO)1. Concept and Foundation
The Adaptive Momentum Cycle Oscillator (AMCO) is an advanced indicator designed to dynamically adjust to varying market conditions while identifying price cycles and trends. It combines momentum and volatility into a single, oscillating signal that helps traders detect turning points in price movements. By incorporating adaptive periods and trend filtering, AMCO ensures relevance across different asset classes and timeframes. This innovation bridges the gap between traditional oscillators and trending indicators, providing a comprehensive tool for both cycle identification and trend confirmation.
2. Dynamic Adaptation to Market Conditions
A standout feature of AMCO is its ability to adapt its sensitivity based on market volatility. Using the ATR (Average True Range) as a measure of current volatility, AMCO adjusts its calculation periods dynamically. During periods of high volatility, it extends its lookback periods to smooth out noise and avoid false signals. Conversely, in low-volatility environments, it shortens its periods to remain responsive to smaller price fluctuations. This adaptability ensures that AMCO remains effective and reliable in both trending and ranging markets.
3. Trend Awareness and Directional Weighting
AMCO integrates a trend filter based on a long-term moving average, such as SMA(200), to align its signals with the broader market direction. This filter ensures that buy signals are prioritized during uptrends and sell signals during downtrends, reducing counter-trend trades. Additionally, a directional weighting mechanism amplifies momentum signals that align with the prevailing trend. This dual-layer approach significantly enhances the accuracy of signals, making AMCO especially useful in markets with clear directional bias.
4. Normalized Visualization for Clarity
The AMCO includes a normalized histogram that provides a clear visual representation of momentum strength relative to recent volatility. By dividing the raw AMCO value by the ATR, the histogram ensures consistency across assets with varying price ranges and volatility levels. Positive bars indicate bullish momentum, while negative bars signify bearish momentum. This intuitive visualization makes it easier for traders to interpret market dynamics and act on actionable signals, regardless of asset type or timeframe.
5. Practical and Actionable Signals
AMCO generates practical signals based on zero-line crossovers, allowing traders to easily identify shifts between bullish and bearish cycles. Positive values above the zero line suggest upward momentum, signaling potential buying opportunities, while negative values below the zero line indicate downward momentum, signaling potential sell opportunities. By combining adaptive behavior, trend filtering, and momentum-strength normalization, AMCO offers traders a robust framework for navigating complex markets with confidence. Its versatility makes it suitable for scalping, swing trading, and even longer-term investing.
Crypto Market Cap Momentum Analyzer (AiBitcoinTrend)The Crypto Market Cap Momentum Analyzer (AiBitcoinTrend) is a robust tool designed to uncover trading opportunities by blending market cap analysis and momentum dynamics. Inspired by research-backed quantitative strategies, this indicator helps traders identify trend-following and mean-reversion setups in the cryptocurrency market by evaluating recent performance and market cap size.
This indicator classifies cryptocurrencies into market cap quintiles and ranks them based on their 2-week momentum. It then suggests potential trades—whether to go long, anticipate reversals, or simply hold—based on the crypto's market cap group and momentum trends.
👽 How the Indicator Works
👾 Market Cap Classification
The indicator categorizes cryptocurrencies into one of five market cap groups based on user-defined inputs:
Large Cap: Highest market cap tier
Upper Mid Cap: Second highest group
Mid Cap: Middle-tier market caps
Lower Mid Cap: Slightly below the mid-tier
Small Cap: Lowest market cap tier
This classification dynamically adjusts based on the provided market cap data, ensuring that you’re always working with a representative market structure.
👾 Momentum Calculation
By default, the indicator uses a 2-week momentum measure (e.g., a 14-day lookback when set to daily). It compares a cryptocurrency’s current price to its price 14 bars ago, thereby quantifying its short-term performance. Users can adjust the momentum period and rebalance period to capture shorter or longer-term trends depending on their trading style.
👾 Dynamic Ranking and Trade Suggestions
After assigning cryptos to size quintiles, the indicator sorts them by their momentum within each quintile. This two-step process results in:
Long Trade: For smaller market cap groups (Small, Lower Mid, Mid Cap) that have low (bottom-quintile) momentum, anticipating a trend continuation or breakout.
Reversal Trade: For the largest market cap group (Large Cap) that shows low momentum, expecting a mean-reversion back to equilibrium.
Hold: In scenarios where the coin’s momentum doesn’t present a strong contrarian or trend-following signal.
👽 Applications
👾 Trend-Following in Smaller Caps: Identify small or mid-cap cryptos with low momentum that might be poised for a breakout or sustained trend.
👾 Mean-Reversion in Large Caps: Pinpoint large-cap cryptocurrencies experiencing a temporary lull in performance, potentially ripe for a rebound.
👽 Why It Works in Crypto
The cryptocurrency market is heavily driven by retail investor sentiment and volatility. Research shows that:
Small-Cap Cryptos: Tend to experience higher volatility and speculative trends, making them ideal for momentum trades.
Large-Cap Cryptos: Exhibit more predictable behavior, making them suitable for mean-reversion strategies when momentum is low.
This indicator captures these dynamics to give traders a strategic edge in identifying both momentum and reversal opportunities.
👽 Indicator Settings
👾 Rebalance Period: The frequency at which momentum and trade suggestions are recalculated (Daily, Weekly, Monthly).
Shorter Periods (Daily): Fast updates, suitable for short-term trades, but more noise.
Longer Periods (Weekly/Monthly): Smoother signals, ideal for swing trading and more stable trends.
👾 Momentum Period: The lookback period for momentum calculation (default is 14 bars).
Shorter Periods: More responsive but prone to noise.
Longer Periods : Reflects broader trends, reducing sensitivity to short-term fluctuations.
Disclaimer: This information is for entertainment purposes only and does not constitute financial advice. Please consult with a qualified financial advisor before making any investment decisions.

LRI Momentum Cycles [AlgoAlpha]Discover the LRI Momentum Cycles indicator by AlgoAlpha, a cutting-edge tool designed to identify market momentum shifts using trend normalization and linear regression analysis. This advanced indicator helps traders detect bullish and bearish cycles with enhanced accuracy, making it ideal for swing traders and intraday enthusiasts alike.
Key Features :
🎨 Customizable Appearance : Set personalized colors for bullish and bearish trends to match your charting style.
🔧 Dynamic Trend Analysis : Tracks market momentum using a unique trend normalization algorithm.
📊 Linear Regression Insight : Calculates real-time trend direction using linear regression for better precision.
🔔 Alert Notifications : Receive alerts when the market switches from bearish to bullish or vice versa.
How to Use :
🛠 Add the Indicator : Favorite and apply the indicator to your TradingView chart. Adjust the lookback period, linear regression source, and regression length to fit your strategy.
📊 Market Analysis : Watch for color changes on the trend line. Green signals bullish momentum, while red indicates bearish cycles. Use these shifts to time entries and exits.
🔔 Set Alerts : Enable notifications for momentum shifts, ensuring you never miss critical market moves.
How It Works :
The LRI Momentum Cycles indicator calculates trend direction by applying linear regression on a user-defined price source over a specified period. It compares historical trend values, detecting bullish or bearish momentum through a dynamic scoring system. This score is normalized to ensure consistent readings, regardless of market conditions. The indicator visually represents trends using gradient-colored plots and fills to highlight changes in momentum. Alerts trigger when the momentum state changes, providing actionable trading signals.

GMO (Gyroscopic Momentum Oscillator) GMO
Overview
This indicator fuses multiple advanced concepts to give traders a comprehensive view of market momentum, volatility, and potential turning points. It leverages the Gyroscopic Momentum Oscillator (GMO) foundation and layers on IQR-based bands, dynamic ATR-adjusted OB/OS levels, torque filtering, and divergence detection. The outcome is a versatile tool that can assist in identifying both short-term squeezes and long-term reversal zones while detecting subtle shifts in momentum acceleration.
Key Components:
Gyroscopic Momentum Oscillator (GMO) – A physics-inspired metric capturing trend stability and momentum by treating price dynamics as “angle,” “angular velocity,” and “inertia.”
IQR Bands – Highlight statistically typical oscillation ranges, providing insight into short-term squeezes and potential near-term trend shifts.
ATR-Adjusted OB/OS Levels – Dynamic thresholds for overbought/oversold conditions, adapting to volatility, aiding in identifying long-term potential reversal zones.
Torque Filtering & Scaling – Smooths and thresholds torque (the rate of change of momentum) and visually scales it for clarity, indicating sudden force changes that may precede volatility adjustments.
Divergence Detection – Highlights potential reversal cues by comparing oscillator swings against price swings, revealing regular and hidden bullish/bearish divergences.
Conceptual Insights
IQR Bands (Short-Term Squeeze & Trend Direction):
Short-Term Momentum and Squeeze: The IQR (Interquartile Range) bands show where the oscillator tends to “live” statistically. When the GMO line hovers within compressed IQR bands, it can signal a momentum squeeze phase. Exiting these tight ranges often correlates with short-term breakout opportunities.
Trend Reversals: If the oscillator pushes beyond these IQR ranges, it may indicate an emerging short-term trend change. Traders can watch for GMO escaping the IQR “comfort zone” to anticipate a new directional move.
Dynamic OB/OS Levels (Long-Term Reversal Zones):
ATR-Based Adaptive Thresholds: Instead of static overbought/oversold lines, this tool uses ATR to adjust OB/OS boundaries. In calm markets, these lines remain closer to ±90. As volatility rises, they approach ±100, reflecting greater permissible swings.
Long-Term Trend Reversal Potential: If GMO hits these dynamically adjusted OB/OS extremes, it suggests conditions ripe for possible long-term trend reversals. Traders seeking major inflection points may find these adaptive levels more reliable than fixed thresholds.
Torque (Sudden Force & Directional Shifts):
Momentum Acceleration Insight: Torque represents the second derivative of momentum, highlighting how quickly momentum is changing. High positive torque suggests a rapidly strengthening bullish force, while high negative torque warns of sudden bearish pressure.
Early Warning & Stability/Volatility Adjustments: By monitoring torque spikes, traders can anticipate momentum shifts before price fully confirms them. This can signal imminent changes in stability or increased volatility phases.
Indicator Parameters and Usage
GMO-Related Inputs:
lenPivot (Default 100): Length for calculating the pivot line (slow market axis).
lenSmoothAngle (Default 200): Smooths the angle measure, reducing noise.
lenATR (Default 14): ATR period for scaling factor, linking price changes to volatility.
useVolatility (Default true): If true, volatility (ATR) influences inertia, adjusting momentum calculations.
useVolume (Default false): If true, volume affects inertia, adding a liquidity dimension to momentum.
lenVolSmoothing (Default 50): Smooths volume calculations if useVolume is enabled.
lenMomentumSmooth (Default 20): EMA smoothing of GMO for a cleaner oscillator line.
normalizeRange (Default true): Normalizes GMO to a fixed range for consistent interpretation.
lenNorm (Default 100): Length for normalization window, ensuring GMO’s scale adapts to recent extremes.
IQR Bands Settings:
iqrLength (Default 14): Period to compute the oscillator’s statistical IQR.
iqrMult (Default 1.5): Multiplier to define the upper and lower IQR-based bands.
ATR-Adjusted OB/OS Settings:
baseOBLevel (Fixed at 90) and baseOSLevel (Fixed at 90): Base lines for OB/OS.
atrPeriodForOBOS (Default 50): ATR length for adjusting OB/OS thresholds dynamically.
atrScaling (Default 0.2): Controls how strongly volatility affects OB/OS lines.
Torque Filtering & Visualization:
torqueSmoothLength (Default 10): EMA length to smooth raw torque values.
atrPeriodForTorque (Default 14): ATR period to determine torque threshold.
atrTorqueScaling (Default 0.5): Scales ATR for determining torque’s “significant” threshold.
torqueScaleFactor (Default 10.0): Multiplies the torque values for better visual prominence on the chart.
Divergence Inputs:
showDivergences (Default true): Toggles divergence signals.
lbR, lbL (Defaults 5): Pivot lookback periods to identify swing highs and lows.
rangeUpper, rangeLower: Bar constraints to validate potential divergences.
plotBull, plotHiddenBull, plotBear, plotHiddenBear: Toggles for each divergence type.
Visual Elements on the Chart
GMO Line (Blue) & Zero Line (Gray):
GMO line oscillates around zero. Positive territory hints bullish momentum, negative suggests bearish.
IQR Bands (Teal Lines & Yellow Fill):
Upper/lower bands form a statistical “normal range” for GMO. The median line (purple) provides a central reference. Contraction near these bands indicates a short-term squeeze, expansions beyond them can signal emerging short-term trend changes.
Dynamic OB/OS (Red & Green Lines):
Red line near +90 to +100: Overbought zone (dynamic).
Green line near -90 to -100: Oversold zone (dynamic).
Movement into these zones may mark significant, longer-term reversal potential.
Torque Histogram (Colored Bars):
Plotted below GMO. Green bars = torque above positive threshold (bullish acceleration).
Red bars = torque below negative threshold (bearish acceleration).
Gray bars = neutral range.
This provides early warnings of momentum shifts before price responds fully.
Precession (Orange Line):
Scaled for visibility, adds context to long-term angular shifts in the oscillator.
Divergence Signals (Shapes):
Circles and offset lines highlight regular or hidden bullish/bearish divergences, offering potential reversal signals.
Practical Interpretation & Strategy
Short-Term Opportunities (IQR Focus):
If GMO compresses within IQR bands, the market might be “winding up.” A break above/below these bands can signal a short-term trade opportunity.
Long-Term Reversal Zones (Dynamic OB/OS):
When GMO approaches these dynamically adjusted extremes, conditions may be ripe for a major trend shift. This is particularly useful for swing or position traders looking for significant turnarounds.
Monitoring Torque for Acceleration Cues:
Torque spikes can precede price action, serving as an early catalyst signal. If torque turns strongly positive, anticipate bullish acceleration; strongly negative torque may warn of upcoming bearish pressure.
Confirm with Divergences:
Divergences between price and GMO reinforce potential reversal or continuation signals identified by IQR, OB/OS, or torque. Use them to increase confidence in setups.
Tips and Best Practices
Combine with Price & Volume Action:
While the indicator is powerful, always confirm signals with actual price structure, volume patterns, or other trend-following tools.
Adjust Lengths & Periods as Needed:
Shorter lengths = more responsiveness but more noise. Longer lengths = smoother signals but greater lag. Tune parameters to match your trading style and timeframe.
Use ATR and Volume Settings Wisely:
If markets are highly volatile, consider useVolatility to refine momentum readings. If liquidity is key, enable useVolume.
Scaling Torque:
If torque bars are hard to read, increase torqueScaleFactor further. The scaling doesn’t affect logic—only visibility.
Conclusion
The “GMO + IQR Bands + ATR-Adjusted OB/OS + Torque Filtering (Scaled)” indicator presents a holistic framework for understanding market momentum across multiple timescales and conditions. By interpreting short-term squeezes via IQR bands, long-term reversal zones via adaptive OB/OS, and subtle acceleration changes through torque, traders can gain advanced insights into when to anticipate breakouts, manage risk around potential reversals, and fine-tune timing for entries and exits.
This integrated approach helps navigate complex market dynamics, making it a valuable addition to any technical analysis toolkit.
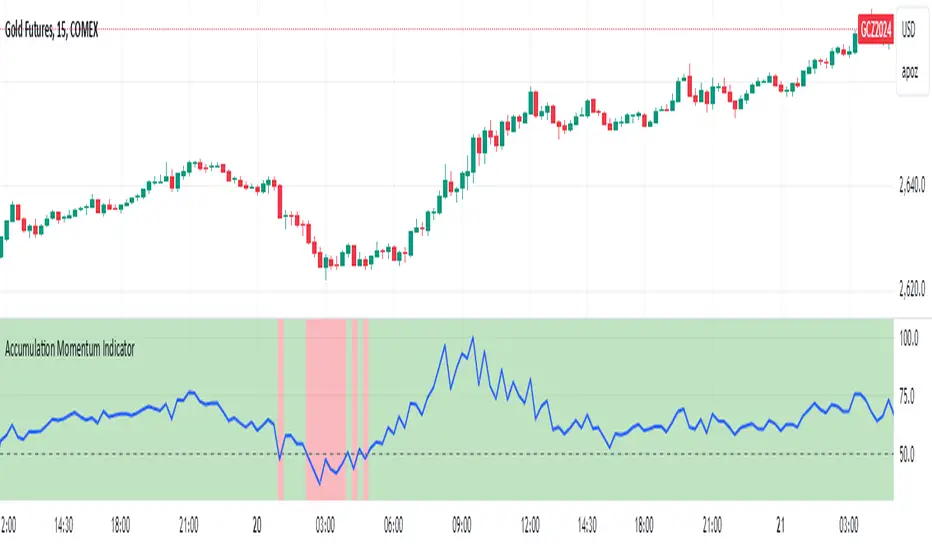
Accumulation Momentum IndicatorEveryone wants to be in a trend, I think this indicator does a great job at showing that key momentum that traders try and capitalize on everyday. I used a Stochastic Momentum Indicator (SMI) indicator. It's a lot like a slower MACD which allows me to capitalize on changing momentum. My goal was to make an indicator that was able to use a weighted mean of many accumulation/momentum indicators. This would give me a well rounded look to really see what direction the momentum and volume is heading.
I did some research on some of the best Accumulation and Momentum Indicators. I landed on 4.
The Accumulation Distribution line which measures the cumulative flow of money in or out of a security. It helps show how quickly money is going in and out of a commodity. The line moving up quickly indicates fast Accumulation while the A/C line is moving down quickly is shows falling Distribution. This can show the momentum and accumulation of a commodity in short and long term based off of Volume.
The On Balance Volume, OBV is a combination of Price Movement and Volume. If price closes higher then the previous bar volume is added while if the price closes lower volume is subtracted. This gives us an overall tally of whether volume is increasing with price or slowing down the momentum in the direction of the current trend. This gives us the ability to see if volume is supporting the price increasing (beginning/middle of a trend) or price is slowing down even though it is still heading in the direction of the current trend (signaling the end of the current trend).
The Force Index, this indicator measures the overall strength of the price movements. It does this by a calculation of price and volume. The close of the current bar subtracted by the previous multiplied by the volume. The result gives us either strong upward or downward motion. This adds magnitude to the overall movement/momentum of the indicator.
Lastly but most certainly not least is the Momentum indicator, (Price Momentum) a simple indicator that shows you the difference between the current close price and the close price from a specified period ago (Most commonly 14 periods/bars ago). Having this indicator is a must because it shows the speed at which price is accelerating or decelerating.
These 4 indicators together help round out the current volume, price movements, accumulation, and momentum of the current market. Since these indicators all have different scales and calculations I had to Normalize the Values to a 0-100 scale. This gives us 1 line and a much more readable easy to understand indicator. After they were normalized I gave them a weighted average that you can control. So lets say you cared more about the Force Index and the OBV rather then the Momentum and the Accumulation Distribution indicators, you would be able to give them more weight in the overall calculation as well as 0 out those you don't even want involved.
I hope the flexibility and the combination of 4 strong Accumulation Momentum indicators helps you better gauge the direction a commodity might head. The way it's used is when the Accumulation Momentum line is Above 50 buying pressure is stronger then selling pressure. An Accumulation Momentum line Below 50 suggests that distribution is more dominant in the current market. This indicator combines four different methods of analyzing price and volume to give you a single composite momentum score, making it easier to visualize when a commodity is being accumulated or distributed and how quickly this process is happening. It helps you track market sentiment based on both price movement and volume, with a clear, visual representation of buying and selling pressure.
Please let me know what you think and how you think I might be able to improve the script. Enjoy!
Trend Momentum Indicator with MACD ConfirmationTrend Momentum Indicator with MACD Confirmation
Overview: The Trend Momentum Indicator with MACD Confirmation is a versatile trading tool designed to help traders identify potential buy and sell signals in the market based on the interaction between price action, a Simple Moving Average (SMA), and the Moving Average Convergence Divergence (MACD) indicator. This strategy aims to enhance trading decisions by waiting for MACD confirmation before executing trades, thereby reducing false signals.
Components:
Simple Moving Average (SMA):
The SMA is calculated over a user-defined period (default: 20 bars) and serves as a trend indicator. It provides a smoothed representation of price action and helps traders identify the overall market direction.
MACD:
The MACD is calculated using standard parameters (12 for fast length, 26 for slow length, and 9 for signal length) but can be adjusted to suit individual trading preferences. The MACD consists of two lines:
MACD Line: The difference between the fast and slow EMAs.
Signal Line: An EMA of the MACD Line, which helps indicate buy and sell conditions.
Buy and Sell Signals:
Buy Signal: A buy signal is triggered when the price crosses above the SMA, coupled with the MACD line crossing above the signal line, indicating a bullish momentum.
Sell Signal: A sell signal occurs when the price crosses below the SMA, alongside the MACD line crossing below the signal line, indicating a bearish momentum.
Visual Features:
The SMA is plotted on the main price chart, allowing traders to easily visualize trend direction.
Buy signals are indicated by green triangle shapes below the price bars, while sell signals are shown by red triangle shapes above the price bars.
Optionally, a MACD histogram can be plotted to visualize the difference between the MACD line and the signal line, helping to confirm trade signals visually.
Usage:
This indicator is suitable for various trading styles, including day trading, swing trading, and trend-following strategies. It can be applied to any financial instrument, including stocks, forex, and cryptocurrencies.
Traders should consider combining this indicator with additional tools and analysis to enhance decision-making and manage risk effectively.

Volume Surge Momentum Detector [CHE]Volume Surge Momentum Detector – Discover explosive price movements fueled by sudden volume spikes.
Volume Surge Momentum Detector – Capture Key Inflection Points Using Volume Dynamics
Description:
This indicator helps traders identify highprobability entries by focusing on volume dynamics. Significant price movements often occur when interest in a stock rises, and this is reflected in volume spikes. The Volume Analysis Indicator is designed to detect key inflection points such as breakouts and capitulations by analyzing the relationship between volume and price. It enables traders to avoid false breakouts, identify trend exhaustion, and make informed trading decisions.
Key Features:
VolumeBased Inflection Points: The indicator tracks the volume levels to detect when there is significant interest in a stock. High volume signals increased market participation, often preceding large price moves.
Breakout Detection: It identifies breakouts by detecting price moves beyond a key level (the highest price over a certain period) along with a volume spike, indicating strong momentum.
Capitulation Detection: Capitulation is detected when a strong trend weakens and reverses with increased volume, signaling potential trend exhaustion.
Volume Thresholds: By using statistical measures, the indicator identifies unusually high or low volume based on the average volume and standard deviations, helping traders to spot major turning points in the market.
This tool simplifies volume bar analysis by automatically highlighting significant volume events, which often indicate large upcoming price movements.
Detailed Breakdown:
1. Volume as a Catalyst for Price Movements:
Volume is essential for price action. Without sufficient volume, price moves may not be sustained. This indicator highlights moments of increased market interest by tracking significant volume increases, helping traders stay ahead of major price movements.
2. Breakouts and Capitulation Detection:
Breakout: Detected when the volume exceeds an upper threshold (based on two standard deviations above the average volume) and the price breaks above the highest close of the previous period. These moments are marked with green labels on the chart.
Capitulation: Detected when volume increases significantly but the trend cannot sustain itself, and the price reverses below the lowest close of the previous period. These moments are marked with red labels on the chart, indicating potential trend exhaustion.
3. Sentiment and Market Dynamics:
Market sentiment can lead to price inflections when one side of the market becomes overbought or exhausted. Volume spikes in either direction provide clues as to whether a trend will continue or reverse. This indicator helps identify these critical points by monitoring volume patterns.
4. Visual Representation:
Green Bars: High volume indicating strong market interest or momentum.
Red Bars: Low volume, signaling potential lack of interest or exhaustion.
Gray Bars: Normal volume, helping to distinguish significant market events from regular activity.
Breakout and Capitulation Labels: Green labels for breakouts and red labels for capitulation points are shown directly on the chart for easy reference.
5. Alerts for Key Signals:
Breakout Alert: Notifies traders when a breakout occurs with strong volume, indicating a potential for significant price movement.
Capitulation Alert: Alerts traders when a capitulation occurs, suggesting a trend reversal.
High and Low Volume Alerts: Receive notifications when the volume exceeds the upper or lower thresholds, highlighting key moments of market interest or disinterest.
Why This Indicator Matters:
Traders often miss significant price moves or enter too late. This indicator helps traders by identifying highprobability entry points before the stock makes major moves. By focusing on volume spikes, the indicator provides insight into market sentiment and allows traders to act quickly.
How It Works:
1. Calculate Volume Significance: The indicator calculates the average volume over a userdefined period (`length`) and identifies significant deviations using standard deviations.
2. Mark Key Levels: Breakouts are detected when price moves above recent highs with significant volume, while capitulation is flagged when trends show exhaustion with a volume spike and price reversal.
3. Receive Alerts: Traders can set up alerts for key events like breakouts, capitulations, and significant volume changes to stay informed in realtime.
Perfect For:
Active traders looking to spot early market movements driven by volume changes.
Traders who want to avoid false breakouts by confirming price moves with volume spikes.
Swing traders identifying capitulation points to reduce exposure or enter positions on trend reversals.
How to Use:
Customize the "Average Period" to determine how many bars are used to calculate the average volume.
Adjust the "Multiplier for Standard Deviation" to finetune the sensitivity of high and low volume detection.
Enable alerts to receive realtime notifications for breakouts, capitulations, or volume spikes.
Conclusion:
Volume analysis is essential to understanding stock movements. This indicator simplifies the process of identifying breakouts and capitulation points by using volume dynamics. Whether you are a beginner looking for powerful tools or an experienced trader refining your strategy, this indicator offers valuable insights into market behavior driven by volume.
Additional Insights:
1. Statistical Significance: The use of standard deviations to identify high and low volume gives the indicator a statistical basis, helping to reduce noise and false signals.
2. Flexible Alerts: Traders can set up custom alerts based on their trading preferences, whether they focus on volume changes or price breakouts and reversals.
This detailed description now includes all the important aspects of the script without referencing any external sources, focusing solely on the functionality and trading strategy the script provides.
Best regards
Chervolino

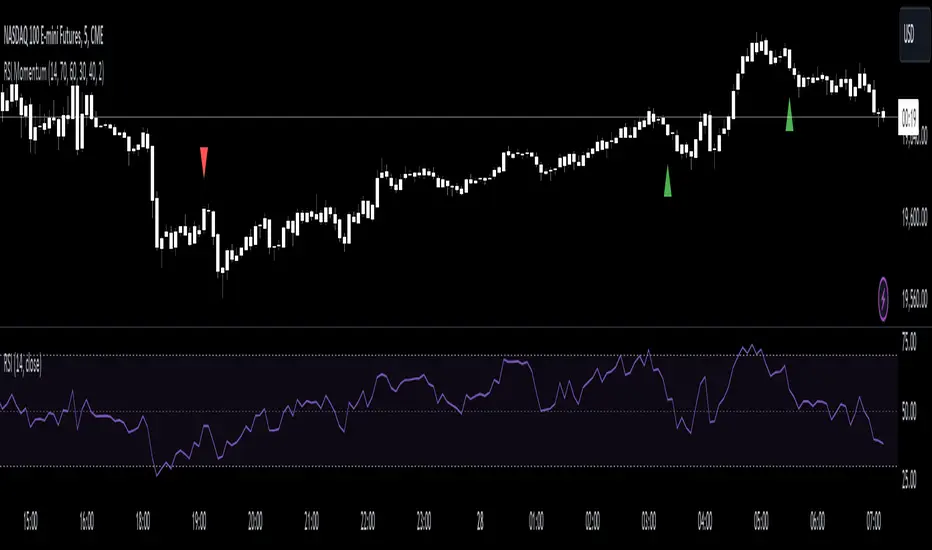
RSI Momentum [CrossTrade]The RSI Momentum indicator generates buy and sell signals based on the Relative Strength Index (RSI) crossing specific thresholds. The Key difference is that we're using RSI overbought and oversold readings as the foundation for finding continuation signals in the same direction of that momentum. This solves the issue of trying to buy the bottom or sell the top and offsets any oscillators main weakness, divergence and false signals in a strong trend.
Key Parameters:
RSI Length: Determines the calculation period for the RSI.
Overbought Threshold: The RSI level above which the asset is considered overbought.
Momentum Loss Threshold for Buy: The RSI level below which a loss in upward momentum is indicated, triggering a potential buy signal.
Oversold Threshold: The RSI level below which the asset is considered oversold.
Momentum Loss Threshold for Sell: The RSI level above which a loss in downward momentum is indicated, triggering a potential sell signal.
Allow Additional Retracement Signals: A toggle to allow more than one signal within a certain number of bars after the first signal.
Max Additional Signals: The maximum number of additional signals allowed after the first signal.
Buy Signal Logic:
Initial Signal: Generated when the RSI first exceeds the overbought threshold and then falls below the momentum loss buy threshold. Defaults are 70 for the overbought threshold and 60 for the retracement level.
Additional Signals for Deeper Retracements: If enabled, the script shows additional buy signals within the maximum limit set by Max Additional Signals. These additional signals are shown only if each new signal's bar has a lower low than the previous signal's bar.
Sell Signal Logic:
Initial Signal: Similar to the buy signal, a sell signal is generated when the RSI first drops below the oversold threshold and then rises above the momentum loss sell threshold. Defaults are 30 for the oversold threshold and 40 for the retracement level.
Additional Signals for Deeper Retracements: If enabled, additional sell signals are shown, limited by Max Additional Signals, and only if each new signal's bar has a higher high than the previous signal's bar.
Continuation Signals in Strong Trends:
The script allows for a new series of signals (starting with the first signal again) when the RSI pattern repeats. For buy signals, this means going above the overbought and then below the momentum loss buy threshold. For sell signals, it's dropping below oversold and then above the momentum loss sell threshold.
Alerts:
The script includes alert conditions for both buy and sell signals, which can be configured in the TradingView alerts.
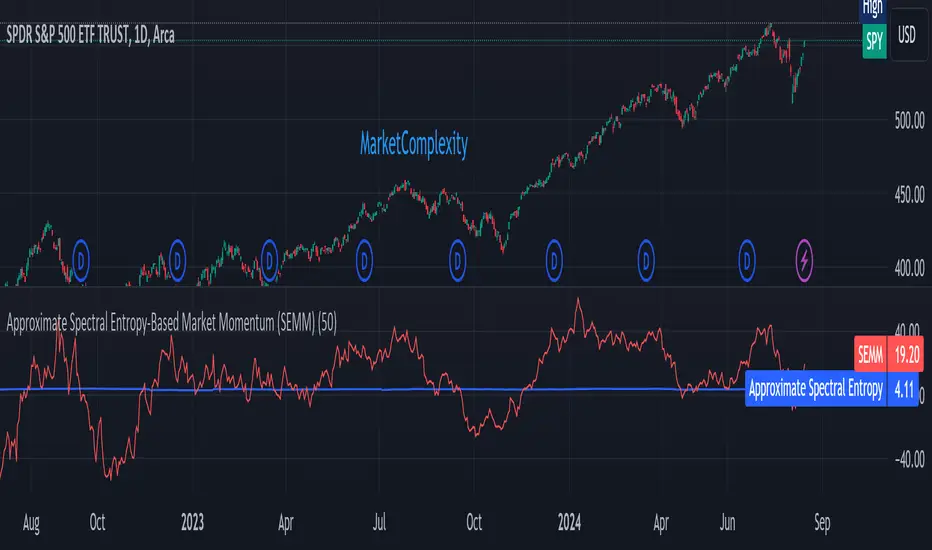
Approximate Spectral Entropy-Based Market Momentum (SEMM)Overview
The Approximate Spectral Entropy-Based Market Momentum (SEMM) indicator combines the concepts of spectral entropy and traditional momentum to provide traders with insights into both the strength and the complexity of market movements. By measuring the randomness or predictability of price changes, SEMM helps traders understand whether the market is in a trending or consolidating state and how strong that trend or consolidation might be.
Key Features
Entropy Measurement: Calculates the approximate spectral entropy of price movements to quantify market randomness.
Momentum Analysis: Integrates entropy with rate-of-change (ROC) to highlight periods of strong or weak momentum.
Dynamic Market Insight: Provides a dual perspective on market behavior—both the trend strength and the underlying complexity.
Customizable Parameters: Adjustable window length for entropy calculation, allowing for fine-tuning to suit different market conditions.
Concepts Underlying the Calculations
The indicator utilizes Shannon entropy, a concept from information theory, to approximate the spectral entropy of price returns. Spectral entropy traditionally involves a Fourier Transform to analyze the frequency components of a signal, but due to Pine Script limitations, this indicator uses a simplified approach. It calculates log returns over a rolling window, normalizes them, and then computes the Shannon entropy. This entropy value represents the level of disorder or complexity in the market, which is then multiplied by traditional momentum measures like the rate of change (ROC).
How It Works
Price Returns Calculation: The indicator first computes the log returns of price data over a specified window length.
Entropy Calculation: These log returns are normalized and used to calculate the Shannon entropy, representing market complexity.
Momentum Integration: The calculated entropy is then multiplied by the rate of change (ROC) of prices to generate the SEMM value.
Signal Generation: High SEMM values indicate strong momentum with higher randomness, while low SEMM values indicate lower momentum with more predictable trends.
How Traders Can Use It
Trend Identification: Use SEMM to identify strong trends or potential trend reversals. Low entropy values can indicate a trending market, whereas high entropy suggests choppy or consolidating conditions.
Market State Analysis: Combine SEMM with other indicators or chart patterns to confirm the market's state—whether it's trending, ranging, or transitioning between states.
Risk Management: Consider high SEMM values as a signal to be cautious, as they suggest increased market unpredictability.
Example Usage Instructions
Add the Indicator: Apply the "Approximate Spectral Entropy-Based Market Momentum (SEMM)" indicator to your chart.
Adjust Parameters: Modify the length parameter to suit your trading timeframe. Shorter lengths are more responsive, while longer lengths smooth out the signal.
Analyze the Output: Observe the blue line for entropy and the red line for SEMM. Look for divergences or confirmations with price action to guide your trades.
Combine with Other Tools: Use SEMM alongside moving averages, support/resistance levels, or other indicators to build a comprehensive trading strategy.
Volume, Volatility, and Momentum Metrics IndicatorVolume, Volatility, and Momentum Metrics Indicator
Welcome to our comprehensive TradingView indicator designed to provide traders with essential volume, volatility, and momentum metrics. This powerful tool is ideal for traders looking to enhance their market analysis by visualizing key indicators in a concise and easy-to-read format.
Key Features
1. Volume Metrics:
• Daily Dollar Volume: Understand the monetary value of the traded volume each day.
• Relative Volume (RVOL) Day: Compare the current volume to the previous day’s volume to gauge trading activity.
• Relative Volume (RVOL) 30D: Assess the average trading volume over the past 30 days.
• Relative Volume (RVOL) 90D: Evaluate the average trading volume over the past 90 days.
2. Volatility and Momentum Metrics:
• Average Daily Range (ADR) %: Measure the average daily price range as a percentage of the current price.
• Average True Range (ATR): Track the volatility by calculating the average true range over a specified period.
• Relative Strength Index (RSI): Determine the momentum by analyzing the speed and change of price movements.
3. Customizable Table Positions:
• Place the volume metrics table and the volatility/momentum metrics table in the bottom-left or bottom-right corners of your chart for optimal visibility and convenience.
Why Use This Indicator?
• Enhanced Market Analysis: Quickly assess volume trends, volatility, and momentum to make informed trading decisions.
• User-Friendly Interface: The clear and concise tables provide at-a-glance information without cluttering your chart.
• Customization Options: Choose where to display the tables to suit your trading style and preferences.
How It Works
This indicator uses advanced calculations to provide real-time data on trading volume, price range, and momentum. By displaying this information in separate, neatly organized tables, traders can easily monitor these critical metrics without diverting their focus from the main chart.
Who Can Benefit?
• Day Traders: Quickly gauge intraday trading activity and volatility.
• Swing Traders: Analyze longer-term volume trends and momentum to identify potential trade setups.
• Technical Analysts: Utilize comprehensive metrics to enhance technical analysis and trading strategies.
Get Started
To add this powerful indicator to your TradingView chart, simply search for “Volume, Volatility, and Momentum Metrics” in the TradingView public library, or use the provided link to add it directly to your chart. Enhance your trading analysis and make more informed decisions with our comprehensive TradingView indicator.

Dynamic Momentum Oscillator (DMO) [Angel Algo]Dynamic Momentum Oscillator (DMO)
OVERVIEW: The Dynamic Momentum Oscillator (DMO) is a technical indicator designed to measure the momentum of price movements in financial markets. It combines momentum calculation with dynamic range assessment to provide insights into potential trend reversals and overbought/oversold conditions.
DMO is different from classic momentum oscillators like the RSI or Stochastic Oscillator because it looks at the momentum in relation to how much the price is moving. This helps it give signals that better match what's happening in the market, especially when the market's volatility is changing.
HOW TO USE:
Interpretation:
Thresholds: Horizontal lines mark user-defined threshold levels for overbought (OB) and oversold (OS) conditions, aiding in identifying potential trend pullbacks and reversals.
DMO Line: The primary line on the indicator plot. It reflects momentum in relation to the dynamic price range. Positive values indicate bullish momentum, while negative values indicate bearish momentum.
Filled Area: The area between the DMO line and the zero line is filled with color to enhance visualization of momentum shifts.
Trading Signals:
Thresholds: Monitor for potential trend reversals when the DMO crosses above the overbought threshold or below the oversold threshold.
Crossovers: Look for buy signals when the DMO line crosses above the zero and sell signals when it crosses below.
Filled Area: The green color indicates bullish momentum, red indicates bearish momentum and gray color indicates neutral conditions.
Signals: Circles appear on the chart when the DMO crosses the overbought or oversold thresholds, indicating conditions for potential trend pullbacks or reversals.
SETTINGS:
Length: Adjust the length parameter to vary the number of periods considered in the momentum calculation.
Smoothing: Enable or disable smoothing of the DMO line using the provided option.
Thresholds: Customize the overbought and oversold threshold levels to suit specific market conditions and trading preferences.
Disclaimer: The DMO indicator serves as part of a comprehensive trading strategy and should not be solely relied upon for trading decisions. Past performance is not indicative of future results, and trading involves inherent risks.

MADALGO`s Enhanced OBV DivergencesDescription:
MADALGO's Enhanced OBV Divergences indicator is a unique tool designed for traders to visualize the divergences between price action and On Balance Volume (OBV), a fundamental aspect often indicative of underlying strength or weakness in the market. By keenly identifying these divergences, traders are better positioned to anticipate potential trend reversals or trend continuations, making this script an invaluable addition to their technical analysis toolkit.
This script meticulously scans for both regular and hidden bullish/bearish divergences, providing a comprehensive view of market sentiment. The core of this indicator is built around the OBV, which cumulatively adds or subtracts volume based on the price movement per period, thus providing a running total of volume and portraying the force behind the price movements.
The regular divergences are classic indicators of a potential reversal in the current trend, while hidden divergences are often indicative of trend continuation. These divergences are pinpointed based on the relative positions of the OBV and price highs/lows, over customizable lookback periods and within specified lookback ranges.
Features:
Regular and Hidden Divergences: Clearly marked bullish and bearish divergences provide insights into potential market turning points.
On Balance Volume (OBV) Line: Visualize the continuous flow of buying and selling pressure, enabling the identification of accumulation or distribution phases essential for understanding the market's strength or weakness.
Moving Average of OBV: An optional feature to smooth the OBV line, aiding in the identification of the overarching trend.
Dynamic Statistics Label: A floating label provides real-time updates on essential statistics like the Rate of Percentage Change (RPC) of OBV, the last divergences, and bars since the last divergences.
Inputs:
Pivot Lookback Right and Pivot Lookback Left: Define the lookback periods for identifying pivot points in the OBV line.
Max of Lookback Range and Min of Lookback Range: Define the range for considering divergences.
RPC Period: Defines the period for calculating the Rate of Percentage Change of the OBV.
MA Period: Defines the period for the optional moving average of the OBV.
Plot Bullish, Plot Hidden Bullish, Plot Bearish, Plot Hidden Bearish: Toggle visibility of respective divergences.
Plot Moving Average: Toggle visibility of the OBV moving average.
Usage:
Add the script to your TradingView chart.
Tailor the input parameters in the settings panel to align with your analysis requirements.
The divergences, OBV line, and optional moving average will be plotted on your chart, with a dynamic label displaying real-time statistics.
Set up alerts to be notified of identified divergences, enabling timely decision-making.
Alerts:
Regular bullish/bearish divergence in OBV found: Triggered when a regular bullish or bearish divergence is identified.
Hidden bullish/bearish divergence in OBV found: Triggered when a hidden bullish or bearish divergence is identified.
Underlying Concepts:
The OBV Divergences indicator is rooted in the principle that volume precedes price movement. When prices are rising with increased volume, it suggests that buying pressure is prevailing and may lead to continued upward momentum. Conversely, rising prices with decreasing volume might indicate a lack of buying conviction and could signal a potential price reversal. The identification of divergences between price and OBV can therefore serve as a powerful signal for traders. These examples can be seen below in the image
The Moving Average of the OBV further aids in understanding the prevailing trend by smoothing out the OBV line, providing a clearer picture of the market's longer-term momentum. The Rate of Percentage Change (RPC) provides insight into the momentum of volume, offering an additional layer of analysis. Together, these additional features enhance the core OBV analysis, enabling a more nuanced understanding of volume dynamics fundamental for making more informed trading decisions.
License:
This Source Code Form is subject to the terms of the Mozilla Public License, v. 2.0. If a copy of the MPL was not distributed with this file, you can obtain one at Mozilla Public License 2.0.

Thange Momentum KicksTitle: Thange Momentum Kicks Indicator - Identify Strong Bullish and Bearish Candles
Description:
The Thange Momentum Kicks indicator is a small tool designed to identify strong bullish and bearish candles in a candlestick price chart. By analyzing the momentum and size of each candle, this indicator highlights potential significant price movements.
The indicator marks strong bullish candles with a "Bull Kick" label to signal their strength on price action. Similarly, strong bearish candles are identified with the "Bear Kick" label. These kicks are characterized by their size and momentum, indicating a high probability of significant price movement.
The indicator allows traders and investors to easily spot these kicks on their charts, helping them make quick decisions. It calculates the percentage momentum of each candle and compares it to the specified thresholds for bullish and bearish kicks.
Key Features:
- Identifies strong bullish and bearish candles ("Kicks") based on momentum and size.
- Customizable input parameters for setting the percentage thresholds for kicks.
- Labels and tooltips provide essential information such as momentum, percentage change, open, and close prices.
- Differentiates between bullish kicks with blue color and bearish kicks with a unique pink color.
- Plots the candles with the specified colors for easy visualization.
Instructions:
1. Look for the "Kicks" labeled candles on your chart.
2. Bullish kicks indicate strong upward momentum, while bearish kicks represent strong downward momentum.
3. Consider the size and momentum of the kicks when making trading decisions.
4. Combine the Thange Momentum Kicks indicator with other technical analysis tools for a comprehensive market analysis.
Note: The Thange Momentum Kicks indicator is most effective when used in conjunction with other indicators, chart patterns, and risk management strategies to confirm signals and optimize trade entries and exits.
Disclaimer: This indicator should be used as a tool for technical analysis and does not guarantee specific trading outcomes. Users should exercise their own discretion and risk management when making trading decisions based on this indicator.
I hope my Thange Momentum Kicks indicator enhances your trading experience and helps you identify strong bullish and bearish candles with ease. Happy trading!
