黄金 GOLD行情大局以及趋势分析
黄⾦正接近⽤于完成⼀个“持续数周、甚⾄数⽉的主要三浪(Wave-3)顶部持续数周还是数顶部”的最⼤价格目标区。任何回落都应被视为修正走势,⽆论该修正持续数周还是数月。长期趋势与前景并未发生改变,2026年后期至2027年,价格仍然有望显著走高,最终可能远高于5,000美元。
⚠更多交易分析及工具可以关注 NeuraAlgo 进行查看!
X-indicator

格陵兰紧张局势升级——黄金找到下一个燃料市场背景(新闻 → 资本流动)
围绕“格陵兰购买”叙事的紧张局势升级,增加了地缘政治风险。
市场以熟悉的模式作出反应:
随着政治不确定性上升,美元走弱
在避险情绪中,股票面临修正压力
避险资金回流黄金,支持进一步上涨
在这种环境下,黄金不仅仅因技术因素上涨,
而是因为防御性资本重新进入市场。
技术结构(H1 – SMC)
价格之前执行了下行流动性扫荡
随后出现了看涨的市场结构转变(MSS)
冲动性走势创造了明显的看涨FVG,表明供需失衡
价格目前保持在FVG之上,保持看涨结构完整
➡️ 一个熟悉的模型在发挥作用:
流动性扫荡 → FVG → 延续
关键区域(决策水平)
上方FVG:4,642.447
下方FVG:4,622.238
更深的支撑(OB):约4,596.733
这些是反应区,而不是FOMO区域。
情景(如果 – 那么)
主要情景 – 延续(~70%)
如果价格保持在4,622.238之上
FVG被认为是防御的
看涨延续至更高水平仍然受到青睐
与美元走弱 + 避险环境一致
替代情景 – 回调(~30%)
如果价格失守4,622.238
可能出现向接近4,596.733的OB的修正走势
只有H1收盘低于OB才会实质性削弱看涨前景
总结
地缘政治头条放大了波动性,
但最终决定在于价格对FVG的反应。
黄金不是追逐头条——
而是跟随寻求安全的资本。

黄金GOLD趋势与基本交易策略周线复合:在周线顶部被确认之前,上⾏空间应当非常有限。
日线复合:在完成日线低点之前,价格⼤概率会有 2–3 天的横盘⾄下⾏⾛势。
关键因素:黄⾦(以及白银)正接近在周线顶部完成之前所能达到的最⼤上⾏价格区间。
交易策略建议:若日线收盘跌破 4,496.1(1 月 6 日收盘价),则表明周线顶部甚⾄数月级别的顶部应已完成。
⚠ 短期交易者应以TradingBox信号系统为准!

所有币股只看好代表 USDC 的 CRCL未来会长期持有CRCL,所有 USDT 一律换成 USDC。
加密世界真正的权力结构
大多数人以为,交易所是加密世界的终点。
项目方想上币,VC 想出货,
KOL 想要流量,散户想赚信息差,
所有人都绕不开 CZ 和一姐。
但他们并不是最顶层
真正站在加密世界顶端的,有两股力量。
第一,是美国司法部,以及背后的 美国金融监管体系 。
它可以决定谁能合规,谁只能退出。赵长鹏在美国司法部面前也得去坐牢加罚款。
第二,是USDT 的缔造者 Tether。
一家员工极少、成本极低、
却一年赚上百亿美元的公司。
稳定币,本质上干的就是无风险套利
USDT 永远处在灰色地带。
而USDC 赢在“合规”二字上。
它会进入 美国主流金融体系,
成为数字美元的接口。
现实已经在给信号
赵长鹏出狱后,
1,币安开始大力推动 USDC 交易对,
甚至用 USDC 做永续合约,0 挂单费。
2,盈透证券开启了USDC的相关出入政策
数据不会骗人
2024 年:
Coinbase 净利润约26 亿美元
Tether 净利润约130 亿美元
用极少的员工和成本,赚极高的利润,
这就是稳定币的威力。
交易平台赚的是手续费。
一旦触碰用户储蓄,就会面临监管。
而USDC 是直接参与“印钱体系”。
长期拿住 $Circle (CRCL.US)$
不买 ERRANTE:COINBASE (COIN.US)$
碰都不要碰跟比特币强绑定的 $Strategy (MSTR.US)$

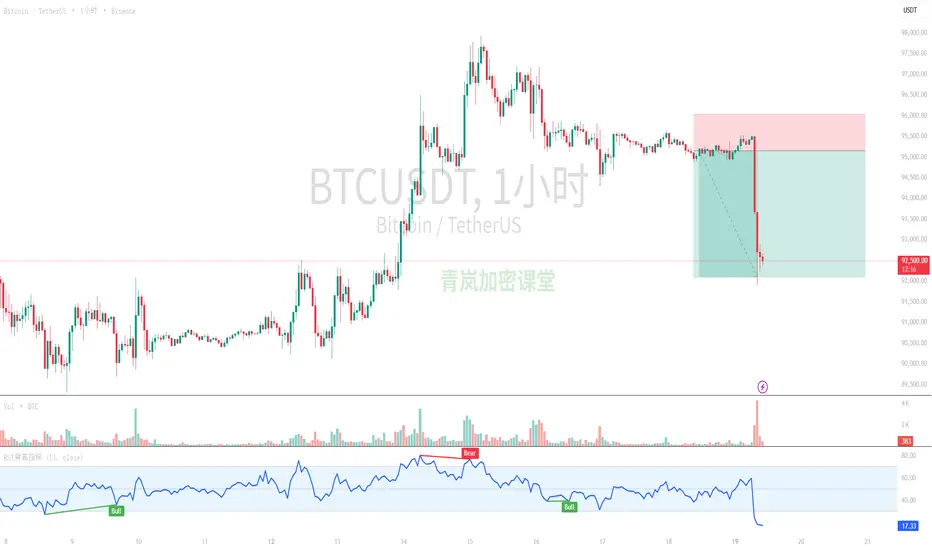
青岚加密课堂:2026年1月20日早间BTC行情分析欢迎来到青岚加密课堂,咱们今天对BTC 四个周期包括消息面进行分析:
咱们先从大周期入手,一步步抽丝剥茧,再结合最新的市场消息,来给大家一个明确的判断和做单思路哦。
---
1. 数据整合与周期趋势分析
从最新的K线数据来看,所有周期目前的收盘价都显示在92534.8美元附近。
* 1日周期(长期):
从11月底到1月初,BTC经历了一波不错的上涨,从8万多美元涨到最高接近9万8千美元。但最近三天(从1月18日开始),价格连续收出阴线,尤其是1月19日和20日,跌势加速,直接把之前的涨幅吃掉了不少。这表明长期上涨趋势的动能已经严重受损,目前处于回调甚至可能转为下跌的早期阶段。
* 4小时周期(中长期):
在1月14日达到9万7千美元的高点后,4小时图开始显示疲态,并在1月19日出现了两根巨量大阴线,直接跌破了多个关键支撑位。这强势地宣告了中长期上涨趋势的终结,目前市场已经进入了明显的下跌通道。
* 1小时周期(中期):
1小时图的跌势最为清晰和猛烈。从1月19日早上7点开始,比特币从9万5千多美元断崖式下跌,一路下探至9万2千多美元。虽然有短暂反弹,但整体呈现出非常强势的下跌趋势,空头力量完全占据了主导。
* 15分钟周期(短期):
短周期内,从01/20 06:00开始也出现了一波急跌,随后在9万2千多美元附近小幅盘整。虽然RSI一度显示超卖并伴随小幅反弹,但反弹力度非常有限,未能有效收复失地,整体仍然是弱势震荡下跌的格局。
---
2. 技术面分析
* MA均线排列:
* 15分钟/1小时/4小时:这些短中期周期上,MA5、MA10、MA20均线都已形成清晰的空头排列(短周期均线在长周期均线下方),并且均线系统都在向下发散。价格远远低于所有均线,这简直就是教科书式的下跌信号呀,表明空头动能非常强劲。
* 1日线:日线图上,MA5和MA10已经形成死叉,并且价格跌破了MA5和MA10,虽然目前仍在MA20(约92601.39美元)附近挣扎,但如果MA20也失守,那么长期均线系统将面临空头排列的风险。
* MACD指标:
* 15分钟/4小时:DIF和DEA线在0轴下方形成死叉或持续向下发散,MACD绿柱体不断放大,显示出强大的空头动能。
* 1小时:MACD指标DIF和DEA线虽然在0轴下方有短暂的金叉迹象,但仍在0轴下方运行,这通常被看作是下跌趋势中的超跌反弹,而不是趋势反转的信号。绿柱变红,但整体趋势仍是向下。
* 1日线:MACD在高位形成死叉,红柱缩短并已转为绿柱,DIF线也已下穿DEA线。这明确指示长期上涨动能衰竭,空头力量开始积聚。
* RSI指标:
* 15分钟/1小时/4小时:RSI指标都处于40以下,甚至多次触及或跌破30的超卖区(1小时RSI最低到17.67,4小时RSI最低到34.01),虽然近期有所反弹,但都在50中线以下运行,表明市场情绪悲观,多头力量孱弱。
* 1日线:RSI从高位70多迅速回落至51.49,接近50中线,显示多头力量快速消退,正向空头市场过渡。
---
3. 消息面结合
咱们今天看到的50条消息中,对BTC短期走势的直接利空信息是相当多的,简直是压倒性的呀:
1. 明确的看空预警:《青岚BTC分析》和《青岚加密晨报》都反复强调“多头别硬扛,趋势在掉头”,指出日线级别的关键支撑MA20失守风险,并关注92300这个关键价位。
2. 巨鲸抛售:多条消息提及“隔夜巨鲸抛售5亿”、“沉睡13年比特币巨鲸苏醒并转移909枚BTC”,这给市场带来了巨大的抛压。
3. ETF资金流出:虽然是1月16日的数据,但“比特币ETF单日流出3.94亿美元”也反映了机构短期获利了结的意愿。
4. 关键支撑面临考验:清算热力图显示90000美元下方存在大量多头头寸,一旦价格跌破这个心理关口,很可能引发连锁清算,甚至可能跌向80000美元,这是非常值得警惕的。
5. 算力下降:AI与比特币矿场争夺电力资源,导致比特币网络算力跌破关键关口,这也是一个不利的基本面因素。
当然啦,也有一些长期利好消息,比如比特币ETF上周吸金22亿美元创纪录,机构对加密货币的长期兴趣不减;纽交所计划推出代币化证券平台;百慕大与Coinbase、Circle合作打造链上经济;甚至金砖国家也在探讨数字货币跨境支付。这些都指向了加密货币未来更广阔的应用前景和机构接受度。但请注意,这些多是长期利好和远期规划,对咱们比特币当前短中期的下跌趋势,暂时无法起到扭转乾坤的作用哦。
---
4. 交易建议
综合咱们所有的K线分析和消息面情况,咱们对BTCUSDT的走势预判非常明确:
* 短期趋势(15分钟/1小时): 明确的下跌趋势,伴随弱势震荡反弹,但反弹动能不足。
* 中期趋势(4小时): 强烈的下跌趋势,上涨结构已经被完全破坏。
* 长期趋势(1日): 由涨转跌的回调趋势,多头动能枯竭,如果日线MA20失守,将确认长期趋势的逆转。
关键的支撑位和阻力位:
* 上方关键阻力: 短期阻力在92700-92800美元,中期阻力在93000-93500美元和94000-95000美元,长期阻力在95000-96000美元。
* 下方关键支撑: 短期支撑在92158美元,下一个重要心理和技术支撑是90000美元,一旦失守,咱们要警惕跌向80000美元的风险(消息面重点提示)。
可能出现的反转形态:
目前所有周期都处于下跌或回调中,短期内出现明确的反转形态(比如W底、头肩底)的可能性较小,更多是下跌途中的技术性反弹。如果真要谈反转,可能需要更长时间的筑底过程,并且伴随巨量的资金流入和多头趋势指标的重新确立。现在,咱们得先看它在哪里能真正止住跌势呀。
做单思路:
在这种市场环境下,咱们的策略一定要保持谨慎和偏空哦!
1. 主动交易者(高位空单):如果价格反弹到92700-93000美元甚至93500美元附近,并且出现滞涨或空头信号(比如小周期MACD死叉、RSI掉头),可以考虑轻仓尝试做空,止损设在明确的阻力位上方(比如93500-93800上方)。
2. 稳健交易者(观望为主):对于大多数投资者来说,目前最好的策略是保持观望。市场风险较高,不确定性大,咱们等待市场给出更明确的止跌信号,或者确认底部结构后再考虑入场。
3. 避免盲目抄底:在强劲的下跌趋势中,盲目抄底风险非常大,很容易被套。咱们要耐心等待,不要与趋势为敌。
4. 关注下方支撑:特别留意92000和90000美元这两个关口,如果90000美元被有效跌破,空头力量可能会进一步释放。
总而言之,目前比特币市场整体偏空,短、中、长期都处于下跌或强劲回调中,咱们得小心应对呀!
---
最后,送大家一句交易金句:
真正的智慧在于认知市场的脆弱,而非盲目追逐涨跌的瞬间。
-------------------------
受限于图表篇幅和平台合规准则,行情分析有时效性,最新的分析已更新在我的青岚加密课堂:qinglan.org 或欢迎点击我的头像关注我,通过主页展示的渠道进行更多技术探讨。

1.20 比特币走势分析:比特币X浪终结临近确认,小级别下跌结构成型后将开启Y浪下跌空头行情(比特币合约交易)军长CRYPTOCAP:BTC 1.20 比特币价格今日行情:市场当前正处在一个关键的结构确认节点。比特币价格现位于92500美元附近,已触及此前预期的0.618斐波那契回调位。核心问题在于,运行了近两个月的大型X浪震荡结构是否已经结束。
从波浪结构看,自8万美元启动的上涨,可以视作一个完整的ABC结构,其中98000美元高点有可能是C浪终点,也即X浪的潜在终点。
目前需等待行情向下再创一个低点,从而确认下跌趋势结构成立。一旦确认,则意味着X浪终结,随后的反抽将提供顺势做空的机会。

金汇得手:黄金高开高走 早盘关注4664-4675区间破位 美元指数昨天低开低走,收十字阴线,今天关注99-98.6区间。
黄金昨天受周末消息面的影响高开高走,最高触及4690附近,接近4700整数关口。由于假期,晚间小区间震荡为主,日线收阳。单看日线今天还是多,但是4700不破的话,要防止行情回调。日线支撑4636-26附近,不破可以多。小时线支撑在4659,这个位置一旦下破,4653未必挡住。如果行情跌破昨天低点,大概率要去补缺口4599,触及可以再多。上方阻力凌晨反弹高点4680附近,不破回落,站稳继续看4690-4700,强阻力4715-4725触及都可以空。
操作建议:接近4680或4700空,接近4636-26多,砸盘关注4664一线。昨天给到4654多,4681空。
原油昨天58.5附近支撑上涨,日线收阳。今天回落做多,日线接近58.8多,走强的话59.2附近先多,目标60附近,强阻力60.8,触及可以空。分析仅供参考,实盘为准。


BTC短线回落预期是实现,要防范空头陷阱BTC日线站稳92K,下方流动性获取完毕,但未跌破趋势线,上升态势暂时,没有反转
空单可部分止盈,如果日线支撑有效,观察回补94.3K拐点价格吸铁石后的量价反应
再决定是否继续追入空单。
今日美股休市,观察纽约时间是否持续抛售,特别是机构ETF既然BTC控盘洗筹多次上演,要防范主力轻车后拉盘,避免调入空头陷阱。


比特币行情大局以及趋势分析10 ⽉的⾼点 很可能已经完成了本轮减半周期的顶部。从该⾼点开始的下跌呈现推动(impulsive),这意味着更⾼时间周期的趋势是熊市,任何反弹都应被视为熊市中的修正,⽽这⼀熊市趋势很可能会持续到明年下半年。
在过去的每⼀轮减半周期中,回撤幅度都超过了70%。
⚠更多交易分析及工具可以关注 NeuraAlgo 进行查看!

特朗普对欧盟征收关税——黄金形成罕见缺口,是否会被填补?市场背景
特朗普宣布对欧盟商品实施新的关税措施,引发了强烈的避险浪潮,资金从风险资产流出,转向黄金作为避风港。
美元反应不一,而黄金则大幅上涨,形成了一个罕见的看涨缺口,清晰地反映了防御性的市场情绪。
现在的关键问题不是黄金的强弱,而是:
这个缺口会被填补,还是会保持以继续趋势?
技术结构(H1)
更广泛的结构仍然看涨,已通过多次结构突破(BOS)得到确认。
最新的冲动性走势在均衡区上方形成了一个看涨的公平价值缺口(GAP)。
价格目前保持在FVG上方,没有明显回到较低水平的迹象。
➡️ 在地缘政治和贸易风险环境中,缺口不需要立即填补。
决策区域
上方FVG / 缺口:4,634.188
均衡区:4,619.928
下方支撑 / 缺口基底:4,596.602
情景(如果 – 那么)
情景1 – 缺口保持 & 继续
如果价格保持在4,619.928以上,缺口将受到保护。
随着避险资金流动的持续,看涨继续向更高水平的可能性增加。
情景2 – 技术性缺口填补
如果价格失守4,619.928,可能会回调至4,596.602以重新平衡。
只有明确的H1收盘低于4,596.602才会确认更深的缺口填补。
总结
与贸易相关的对抗正在改变价格行为,导致黄金反应比平时更为激烈。
在这个阶段,缺口代表了继续与修正之间的决策点。
缺口处的反应将决定下一步行动。
交易反应,而不是头条新闻。

青岚加密课堂:2026年1月19日早间BTC行情分析欢迎来到青岚加密课堂,咱们今天对BTC 四个周期包括消息面进行分析:
先说结论:短期暴跌后进入超卖修复,中期上涨结构面临考验,长期牛市格局仍在但需休整。整体预判为先反弹后震荡,关键看反弹力度。
一、 周期与技术面糅合分析
1. 日线(长期趋势):格局在,但累了。
趋势与形态:价格在1月14日创下新高后,进入高位平台整理。今早的大跌(从约95400跌至最低91910)可以看作是突破前高后的深度回踩和获利盘集中了结。MA5(5日均线)开始走平,MA10、MA20仍呈多头排列,说明长期上涨的大结构还没被破坏,但短期上攻动能明显减弱。
关键位:92500-93000区域是前期平台和MA20均线附近,构成关键支撑带。如果有效跌破,可能进一步下探90000心理关口。上方95500-96500是近期高点区域,形成强阻力。
指标:MACD红柱子(动能)在缩短,RSI从超买区回落至51.6,属于健康回调。但今早的急跌让日线级别出现了超卖迹象。
2. 4小时线(中期趋势):结构破坏,进入调整。
趋势:价格已经跌破了从1月12日开始的上升趋势线,确认了中期调整格局。MA5、MA10均线开始拐头向下,有下穿MA20形成死叉的趋势。
关键位:92500是前一波上涨的起涨平台和斐波那契0.382回撤位,是多空必争之地。下方更强支撑在90000-91000(0.5回撤及前期密集成交区)。反弹的初步阻力在94500-95000(跌破的趋势线反压及MA20均线)。
指标:MACD在零轴上方高位死叉后,快慢线快速下穿零轴,绿柱子(空头动能)急剧放大,显示空头力量强劲释放。RSI跌至32.3,进入超卖区,存在技术性反弹需求。
3. 1小时 & 15分钟线(短期趋势):暴跌后的疗伤与反弹试探。
走势:今天早上7-8点(UTC)的15分钟和1小时图上演了“瀑布行情”,成交量巨幅放大,这是典型的恐慌性抛售。但随后在92500下方(最低91910)获得买盘支撑,价格快速反弹至92500上方,并在此位置附近横盘震荡。
关键信号:
背离初现:在15分钟图上,价格创出新低(91910)时,RSI指标并未同步创新低,形成了底背离,这是短期止跌反弹的第一个技术信号。
超卖反弹:1小时和15分钟的RSI都一度跌至10以下的极端超卖区域,目前修复至20-30区间,反弹动能仍在积累。
关键位:短期支撑就在92500,跌破则可能再次测试早盘低点。阻力在93500-94000(早盘跳水后的反弹高点及1小时MA10均线压力)。
二、 消息面共振解读
消息面和咱们的技术面形成了强烈共振:
1. 利空兑现与消化:青岚姐在晨报和早评里都提到了“早盘变盘预警”、“先疗伤别冲锋”。今早的暴跌,结合消息面看,可能部分消化了“比特币元老抛售”、“ETF单日资金流出”等利空,同时市场也提前反应了部分主流币(如SHIB、ADA)技术破位的情绪。
2. 长期信心仍在:另一方面,“美国比特币ETF创近三月最佳周流入”、“先锋集团首次投资比特币股票”、“MicroStrategy暗示继续增持”这些消息,都表明机构和中长线资金对后市的信心并未动摇。这为长期趋势提供了基本面支撑。
3. 市场情绪切换:消息面频繁提及“社交叙事主导”、“资金寻求新机会(如ZKP等)”,说明市场热点在轮动,资金从部分高位资产流向新叙事,这加剧了BTC市场的波动和获利了结压力。
三、 咱们的预判与做单思路
综合来看,市场经历了一次“暴力洗盘”。短期情绪释放过度,有技术性反弹需求;但中期调整格局已定,需要时间修复。
预判:未来1-2天大概率在92500-94500区间震荡筑底。走法可能是:在92500支撑上反复测试夯实 -> 向上尝试触碰94000-94500阻力 -> 遇阻回落再次确认支撑。直接V型反转创新高的可能性较低。
做单思路:
短线(日内):低多为主,高空为辅。可在价格回踩92800-92500且出现小级别(如15分钟)止跌信号时,轻仓试多,目标93500-94000,止损放在92500下方。若反弹至94000-94500滞涨,可考虑短空,快进快出。
中线(未来几日):耐心等待更明确的企稳信号。理想的介入做多位置在91500-90500区域(强支撑区),或者等待价格重新站稳95000并伴随4小时MACD金叉。当前不宜盲目追涨杀跌。
长线:持有现货的学员,只要不跌破90000关键位,可以继续持有,忽略短期波动。想加仓的,可以采取分批定投的方式,在90000、88000等关键支撑位附近布局。
最后,送大家一句今天特别应景的金句:市场最好的老师不是暴涨,而是暴跌,它能让你看清谁在裸泳,也能让真正的价值浮出水面。保持耐心,保持清醒,咱们一起穿越周期。
-------------------------
受限于图表篇幅和平台合规准则,行情分析有时效性,最新的分析已更新在我的青岚加密课堂:qinglan.org 或欢迎点击我的头像关注我,通过主页展示的渠道进行更多技术探讨。
比特币趋势与交易策略周线复合:混合,但周级别已处在超买区。
日线复合:日线短期趋势应为横盘⾄下跌,日线⾼点临近,可能与周⾼点重合。
关键因素:1 月 13 日⾄ 15 日是完成本轮修正的重要日线时间窗⼝。目前为⽌的最⾼收盘价出现在 1 月 14 日。w5/c 在修正完成之前,上⾏空间应当是有限的。
交易策略建议:若日线收盘跌破 93,340(12 月9 日收盘价),则表明周线顶部已经完成,随后应出现新的低点。这将构成明确的做空或策略的启动信号。
⚠ 短期交易者应以TradingBox信号系统为准!

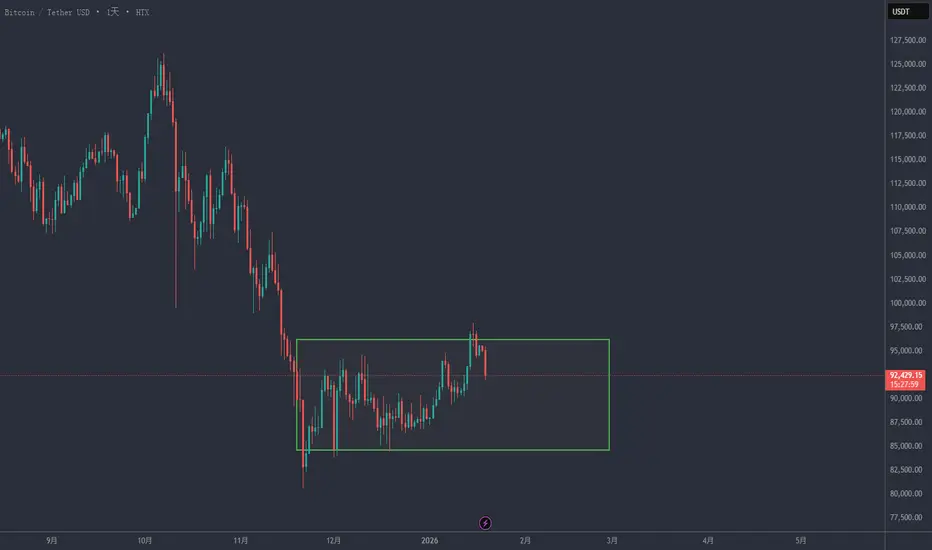
BTC每周预判0119:继续箱体市场上周冲高回落,符合短期很难有波段趋势行情的预判。
BTC本周在91000之下运行,转弱;在91000之上运行,短线还有再尝试反弹的可能。
短期继续是震荡格局,低吸高抛。
如果没有事件和消息催化,这个日线箱体震荡就还需要一些时间,耐心等待突破这个箱体后的方向选择。


(有梦分析)周一黄金计划多空关键位之上偏多,当前行情区间震荡,以高抛低吸为主,突破看多下破看空为辅,周一黄金计划多空关键位之上偏多,当前行情区间震荡,以高抛低吸为主,突破看多下破看空为辅,每一次进场必须要有信号而且背靠关键位。

