Fibonacci Confluence Toolkit [LuxAlgo]The Fibonacci Confluence Toolkit is a technical analysis tool designed to help traders identify potential price reversal zones by combining key market signals and patterns. It highlights areas of interest where significant price action or reactions are anticipated, automatically applies Fibonacci retracement levels to outline potential pullback zones, and detects engulfing candle patterns.
Its unique strength lies in its reliance solely on price patterns, eliminating the need for user-defined inputs, ensuring a robust and objective analysis of market dynamics.
🔶 USAGE
The script begins by detecting CHoCH (Change of Character) points—key indicators of shifts in market direction. This script integrates the principles of pure price action as applied in Pure-Price-Action-Structures , where further details on the detection process can be found.
The detected CHoCH points serve as the foundation for defining an Area of Interest (AOI), a zone where significant price action or reactions are anticipated.
As new swing highs or lows emerge within the AOI, the tool automatically applies Fibonacci retracement levels to outline potential retracement zones. This setup enables traders to identify areas where price pullbacks may occur, offering actionable insights into potential entries or reversals.
Additionally, the toolkit highlights engulfing candle patterns within these zones, further refining entry points and enhancing confluence for better-informed trading decisions based on real-time trend dynamics and price behavior.
🔶 SETTINGS
🔹 Market Patterns
Bullish Structures: Enable or disable all bullish components of the indicator.
Bearish Structures: Enable or disable all bearish components of the indicator.
Highlight Area of Interest: Toggle the option to highlight the Areas of Interest (enabled or disabled).
CHoCH Line: Choose the line style for the CHoCH (Solid, Dashed, or Dotted).
Width: Adjust the width of the CHoCH line.
🔹 Retracement Levels
Choose which Fibonacci retracement levels to display (e.g., 0, 0.236, 0.382, etc.).
🔹 Swing Levels & Engulfing Patterns
Swing Levels: Select how swing levels are marked (symbols like ◉, △▽, or H/L).
Engulfing Candle Patterns: Choose which engulfing candle patterns to detect (All, Structure-Based, or Disabled).
🔶 RELATED SCRIPTS
Pure-Price-Action-Structures.
指标和策略

Linear Regression Channel [TradingFinder] Existing Trend Line🔵 Introduction
The Linear Regression Channel indicator is one of the technical analysis tool, widely used to identify support, resistance, and analyze upward and downward trends.
The Linear Regression Channel comprises five main components : the midline, representing the linear regression line, and the support and resistance lines, which are calculated based on the distance from the midline using either standard deviation or ATR.
This indicator leverages linear regression to forecast price changes based on historical data and encapsulates price movements within a price channel.
The upper and lower lines of the channel, which define resistance and support levels, assist traders in pinpointing entry and exit points, ultimately aiding better trading decisions.
When prices approach these channel lines, the likelihood of interaction with support or resistance levels increases, and breaking through these lines may signal a price reversal or continuation.
Due to its precision in identifying price trends, analyzing trend reversals, and determining key price levels, the Linear Regression Channel indicator is widely regarded as a reliable tool across financial markets such as Forex, stocks, and cryptocurrencies.
🔵 How to Use
🟣 Identifying Entry Signals
One of the primary uses of this indicator is recognizing buy signals. The lower channel line acts as a support level, and when the price nears this line, the likelihood of an upward reversal increases.
In an uptrend : When the price approaches the lower channel line and signs of upward reversal (e.g., reversal candlesticks or high trading volume) are observed, it is considered a buy signal.
In a downtrend : If the price breaks the lower channel line and subsequently re-enters the channel, it may signal a trend change, offering a buying opportunity.
🟣 Identifying Exit Signals
The Linear Regression Channel is also used to identify sell signals. The upper channel line generally acts as a resistance level, and when the price approaches this line, the likelihood of a price decrease increases.
In an uptrend : Approaching the upper channel line and observing weakness in the uptrend (e.g., declining volume or reversal patterns) indicates a sell signal.
In a downtrend : When the price reaches the upper channel line and reverses downward, this is considered a signal to exit trades.
🟣 Analyzing Channel Breakouts
The Linear Regression Channel allows traders to identify price breakouts as strong signals of potential trend changes.
Breaking the upper channel line : Indicates buyer strength and the likelihood of a continued uptrend, often accompanied by increased trading volume.
Breaking the lower channel line : Suggests seller dominance and the possibility of a continued downtrend, providing a strong sell signal.
🟣 Mean Reversion Analysis
A key concept in using the Linear Regression Channel is the tendency for prices to revert to the midline of the channel, which acts as a dynamic moving average, reflecting the price's equilibrium over time.
In uptrends : Significant deviations from the midline increase the likelihood of a price retracement toward the midline.
In downtrends : When prices deviate considerably from the midline, a return toward the midline can be used to identify potential reversal points.
🔵 Settings
🟣 Time Frame
The time frame setting enables users to view higher time frame data on a lower time frame chart. This feature is especially useful for traders employing multi-time frame analysis.
🟣 Regression Type
Standard : Utilizes classical linear regression to draw the midline and channel lines.
Advanced : Produces similar results to the standard method but may provide slightly different alignment on the chart.
🟣 Scaling Type
Standard Deviation : Suitable for markets with stable volatility.
ATR (Average True Range) : Ideal for markets with higher volatility.
🟣 Scaling Coefficients
Larger coefficients create broader channels for broader trend analysis.
Smaller coefficients produce tighter channels for precision analysis.
🟣 Channel Extension
None : No extension.
Left: Extends lines to the left to analyze historical trends.
Right : Extends lines to the right for future predictions.
Both : Extends lines in both directions.
🔵 Conclusion
The Linear Regression Channel indicator is a versatile and powerful tool in technical analysis, providing traders with support, resistance, and midline insights to better understand price behavior. Its advanced settings, including time frame selection, regression type, scaling options, and customizable coefficients, allow for tailored and precise analysis.
One of its standout advantages is its ability to support multi-time frame analysis, enabling traders to view higher time frame data within a lower time frame context. The option to use scaling methods like ATR or standard deviation further enhances its adaptability to markets with varying volatility.
Designed to identify entry and exit signals, analyze mean reversion, and assess channel breakouts, this indicator is suitable for a wide range of markets, including Forex, stocks, and cryptocurrencies. By incorporating this tool into your trading strategy, you can make more informed decisions and improve the accuracy of your market predictions.

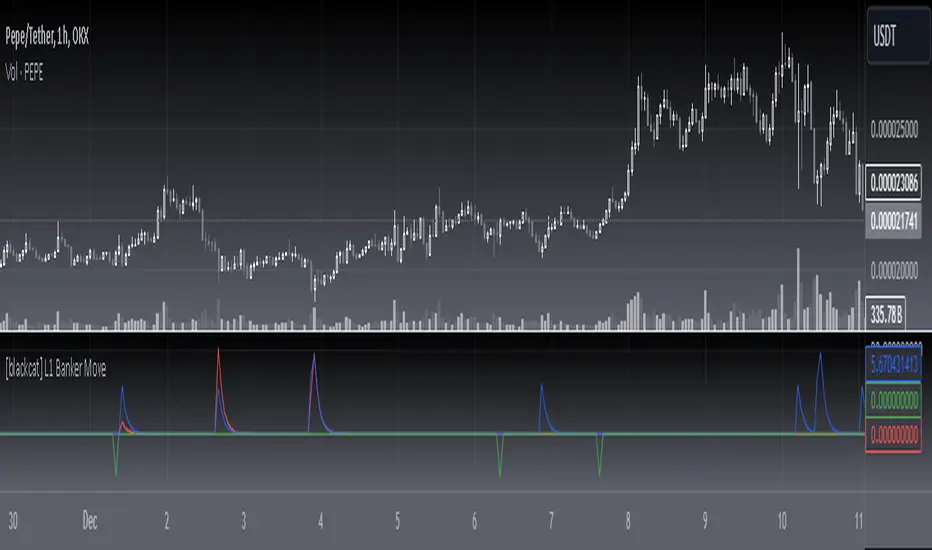
[blackcat] L1 Banker Move█ OVERVIEW
The Pine Script is an indicator designed to analyze market signals for institutional and short-term investors. It calculates and plots three main signals: Institutional Signal, Institutional Build, and Short-Term Investor Signal. The script uses a combination of price, volume, and moving average data to generate these signals, which can help traders identify potential buying or selling opportunities.
█ LOGICAL FRAMEWORK
The script is structured into several main sections:
1 — Input Parameters
The script does not explicitly define any input parameters, relying on default values for calculations.
2 — Custom Functions
• reference_value(values, length) : Retrieves the first non-NA value from a specified number of past values.
• calculate_institutional_and_short_term_signals(low, close, open, volume) : Calculates the institutional and short-term investor signals based on price, volume, and moving average data.
3 — Calculations
• Price and Volume Metrics: The script calculates various smoothed price changes, lowest and highest values over different periods, and volume-weighted prices.
• Moving Averages: It computes simple moving averages (SMA) and exponential moving averages (EMA) for different periods.
• RSI Calculation: The script calculates a custom RSI for different periods.
• Signal Generation: It generates the institutional and short-term investor signals based on the calculated metrics.
4 — Plotting
The script plots the three main signals on the chart using the plot function.
The flow of data and logic is as follows:
• The reference_value function is used to find reference values for calculations.
• The calculate_institutional_and_short_term_signals function performs the core calculations and returns the institutional and short-term investor signals.
• The main script calls this function and plots the results.
█ CUSTOM FUNCTIONS
1 — reference_value(values, length)
• Purpose : Retrieves the first non-NA value from a specified number of past values.
• Parameters :
• values: An array of values.
• length: The number of past values to consider.
• Return Value : The first non-NA value found or na if no valid value is found.
• Functionality : Iterates through the specified number of past values and returns the first non-NA value.
2 — calculate_institutional_and_short_term_signals(low, close, open, volume)
• Purpose : Calculates the institutional and short-term investor signals based on price, volume, and moving average data.
• Parameters :
• low: Low price series.
• close: Close price series.
• open: Open price series.
• volume: Volume series.
• Return Values :
• institutional_signal: The institutional signal.
• institutional_build: The institutional build signal.
• short_term_investor_signal: The short-term investor signal.
• Functionality :
• Computes various price and volume metrics.
• Calculates moving averages and volume-weighted prices.
• Generates the institutional and short-term investor signals based on these metrics.
█ KEY POINTS AND TECHNIQUES
1 — Advanced Pine Script Features
• Custom Functions: The script defines and uses custom functions to encapsulate complex logic.
• Conditional Statements: Extensive use of iff and if statements to control the flow of calculations.
• Looping Constructs: The for loop in reference_value function to iterate through past values.
• Exponential Moving Averages (EMA): Used to smooth out price and signal changes.
• Volume-Weighted Price (VWP): Calculated to factor in volume in price analysis.
• Custom RSI Calculation: A custom RSI formula is used, which differs from the standard RSI calculation.
2 — Optimization Techniques
• Efficient Data Handling: The reference_value function efficiently finds the first non-NA value without unnecessary computations.
• Smoothed Signals: Using EMAs to smooth out noisy signals for better trend identification.
3 — Unique Approaches
• Combination of Metrics: The script combines multiple metrics (price, volume, moving averages, and custom RSI) to generate comprehensive signals.
• Institutional Build Signal: A unique approach to detect institutional activity by comparing current price levels with historical lows and smoothed price changes.
█ EXTENDED KNOWLEDGE AND APPLICATIONS
1 — Potential Modifications
• Input Parameters: Add input parameters to allow users to customize the lengths and thresholds used in the calculations.
• Strategy Version: Convert the indicator into a strategy by adding buy/sell signals based on the generated signals.
• Additional Indicators: Integrate other technical indicators (e.g., MACD, Bollinger Bands) to enhance the signal generation process.
2 — Similar Trading Scenarios
• Institutional Activity Analysis: Use similar techniques to analyze institutional activity in other markets or assets.
• Volume Analysis: Apply the volume-weighted price and volume analysis to identify significant price movements.
• Multi-Timeframe Analysis: Extend the script to analyze signals across multiple timeframes for a more robust trading strategy.
3 — Related Pine Script Concepts
• Pine Script Functions: Understanding how to define and use custom functions effectively.
• Conditional Logic: Mastering the use of iff and if statements for complex logic.
• Looping Constructs: Familiarity with for loops for iterating through data.
• Moving Averages: Knowledge of different types of moving averages and their applications.
• Volume Analysis: Techniques for incorporating volume data into price analysis.
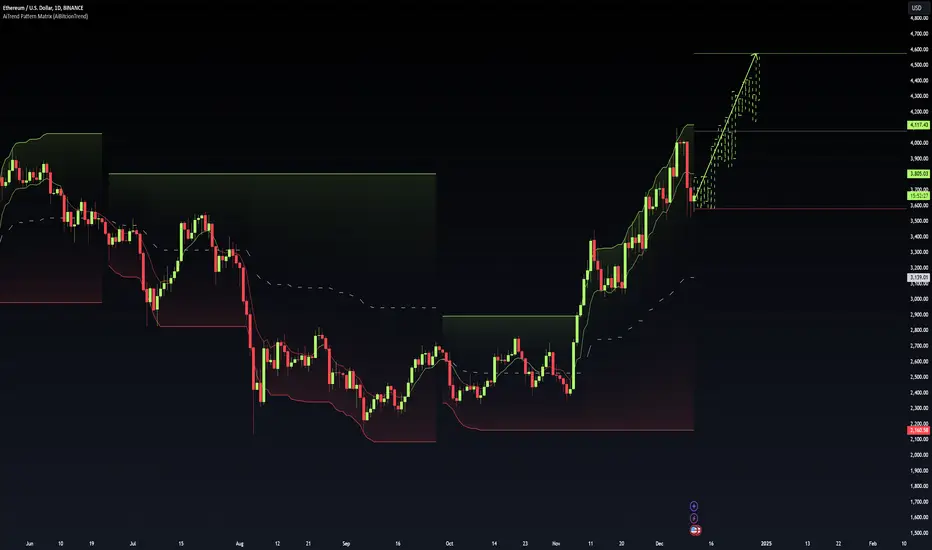
AiTrend Pattern Matrix for kNN Forecasting (AiBitcoinTrend)The AiTrend Pattern Matrix for kNN Forecasting (AiBitcoinTrend) is a cutting-edge indicator that combines advanced mathematical modeling, AI-driven analytics, and segment-based pattern recognition to forecast price movements with precision. This tool is designed to provide traders with deep insights into market dynamics by leveraging multivariate pattern detection and sophisticated predictive algorithms.
👽 Core Features
Segment-Based Pattern Recognition
At its heart, the indicator divides price data into discrete segments, capturing key elements like candle bodies, high-low ranges, and wicks. These segments are normalized using ATR-based volatility adjustments to ensure robustness across varying market conditions.
AI-Powered k-Nearest Neighbors (kNN) Prediction
The predictive engine uses the kNN algorithm to identify the closest historical patterns in a multivariate dictionary. By calculating the distance between current and historical segments, the algorithm determines the most likely outcomes, weighting predictions based on either proximity (distance) or averages.
Dynamic Dictionary of Historical Patterns
The indicator maintains a rolling dictionary of historical patterns, storing multivariate data for:
Candle body ranges, High-low ranges, Wick highs and lows.
This dynamic approach ensures the model adapts continuously to evolving market conditions.
Volatility-Normalized Forecasting
Using ATR bands, the indicator normalizes patterns, reducing noise and enhancing the reliability of predictions in high-volatility environments.
AI-Driven Trend Detection
The indicator not only predicts price levels but also identifies market regimes by comparing current conditions to historically significant highs, lows, and midpoints. This allows for clear visualizations of trend shifts and momentum changes.
👽 Deep Dive into the Core Mathematics
👾 Segment-Based Multivariate Pattern Analysis
The indicator analyzes price data by dividing each bar into distinct segments, isolating key components such as:
Body Ranges: Differences between the open and close prices.
High-Low Ranges: Capturing the full volatility of a bar.
Wick Extremes: Quantifying deviations beyond the body, both above and below.
Each segment contributes uniquely to the predictive model, ensuring a rich, multidimensional understanding of price action. These segments are stored in a rolling dictionary of patterns, enabling the indicator to reference historical behavior dynamically.
👾 Volatility Normalization Using ATR
To ensure robustness across varying market conditions, the indicator normalizes patterns using Average True Range (ATR). This process scales each component to account for the prevailing market volatility, allowing the algorithm to compare patterns on a level playing field regardless of differing price scales or fluctuations.
👾 k-Nearest Neighbors (kNN) Algorithm
The AI core employs the kNN algorithm, a machine-learning technique that evaluates the similarity between the current pattern and a library of historical patterns.
Euclidean Distance Calculation:
The indicator computes the multivariate distance across four distinct dimensions: body range, high-low range, wick low, and wick high. This ensures a comprehensive and precise comparison between patterns.
Weighting Schemes: The contribution of each pattern to the forecast is either weighted by its proximity (distance) or averaged, based on user settings.
👾 Prediction Horizon and Refinement
The indicator forecasts future price movements (Y_hat) by predicting logarithmic changes in the price and projecting them forward using exponential scaling. This forecast is smoothed using a user-defined EMA filter to reduce noise and enhance actionable clarity.
👽 AI-Driven Pattern Recognition
Dynamic Dictionary of Patterns: The indicator maintains a rolling dictionary of N multivariate patterns, continuously updated to reflect the latest market data. This ensures it adapts seamlessly to changing market conditions.
Nearest Neighbor Matching: At each bar, the algorithm identifies the most similar historical pattern. The prediction is based on the aggregated outcomes of the closest neighbors, providing confidence levels and directional bias.
Multivariate Synthesis: By combining multiple dimensions of price action into a unified prediction, the indicator achieves a level of depth and accuracy unattainable by single-variable models.
Visual Outputs
Forecast Line (Y_hat_line):
A smoothed projection of the expected price trend, based on the weighted contribution of similar historical patterns.
Trend Regime Bands:
Dynamic high, low, and midlines highlight the current market regime, providing actionable insights into momentum and range.
Historical Pattern Matching:
The nearest historical pattern is displayed, allowing traders to visualize similarities
👽 Applications
Trend Identification:
Detect and follow emerging trends early using dynamic trend regime analysis.
Reversal Signals:
Anticipate market reversals with high-confidence predictions based on historically similar scenarios.
Range and Momentum Trading:
Leverage multivariate analysis to understand price ranges and momentum, making it suitable for both breakout and mean-reversion strategies.
Disclaimer: This information is for entertainment purposes only and does not constitute financial advice. Please consult with a qualified financial advisor before making any investment decisions.
ProfitStars_SignalsScript based on various methods of technical analysis. This tool combines:
1) definition of inclined support and resistance levels
2) fixation of price breakout of inclined levels, during which liquidity is collected and stop losses are triggered
Thus, the indicator determines potentially false breakouts of inclined levels.
Label "B" - buy signal (when the resistance level is broken)
Label "S" - sell signal (when the support level is broken)
Label "FIX" - position fixation
the indicator contains position averaging
Parameters:
MA / Standard / Deviation Length / Extra High Multiplier - responsible for determining the presence of liquidity (universal settings are specified by default)
Signal strength / Signal accuracy - responsible for the accuracy of the signal, these parameters can be independently adjusted to the market:
Signal accuracy - optimal value 85 - 115
Signal accuracy - optimal value 90 - 250
The indicator does not contain history rewriting properties
A very important setting is "Flat Filter". This is an additional transaction filter that filters abnormally impulse movements on the market, since the indicator works best in correction movements. The filter is based on determining the corrective price movement within a certain range BYBIT:ARBUSDT.P
"Flat Filter" filter settings:
- If the "Flat Filter" checkbox is enabled, the filter is applied
- "Flat size" – the size of the correction movement within which signals are given (the optimal value is set by default to 155)
- "Flat Multiplier" – the multiplier of the size of the correction movement (the optimal value is set by default to 1.5)
- "Flat length" – is responsible for restructuring the flat (the higher the value, the more stable the flat)
The indicator is constantly supported and will be supplemented with useful functions: signal filters, additional options for fixing positions, stop losses


Tomas' Financial Conditions Z Score"The indicator is a composite z-score comprised of the following four components (equally-weighted):
Credit spreads - ICE BofA High Yield Option Adjusted Spread (BAMLH0A0HYM2) and ICE BofA Corporate Index Option Adjusted Spread (BAMLC0A0CM)
Volatility indexes - VIX (S&P 500 implied volatility) and MOVE (US Treasury bond implied volatility)
I've got it set to a 160-day lookback period, which I think is roughly the best setting after some tinkering.
When the z-score is above zero, it throws a red signal - and when the z-score is below zero, it throws a green signal.
This indicator is a follow-on from the "traffic light financial conditions indicator" that I wrote a thread about a couple of months ago.
I moved on from that previous indicator because it is based on the Federal Reserve's NFCI, which is regularly revised, but I didn't take that into account at the time.
So not a great real-time indicator, if the signal can be subsequently revised in the opposite direction weeks later.
This new indicator is based on real-time market data, so there's no revisions, and it also updates daily, as opposed to weekly for the NFCI"

Auto Detection of Support/Resistance LinesThe script automatically detect support and resistance lines by calculating vertical volume profile.

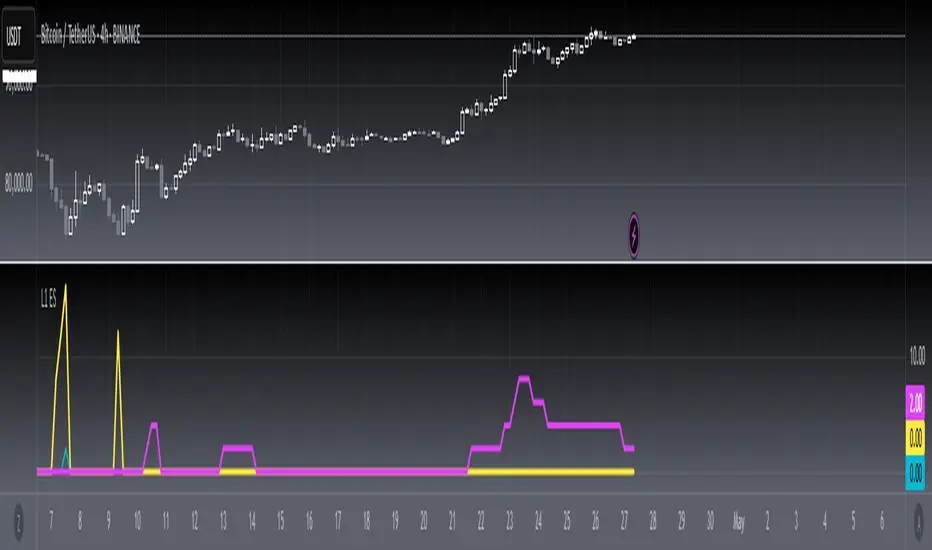
[blackcat] L1 Extreme Shadows█ OVERVIEW
The Pine Script provided is an indicator designed to detect market volatility and extreme shadow conditions. It calculates various conditions based on simple moving averages (SMAs) and plots the results to help traders identify potential market extremes. The primary function of the script is to provide visual cues for extreme market conditions without generating explicit trading signals.
█ LOGICAL FRAMEWORK
Structure:
1 — Input Parameters:
• No user-defined input parameters are present in this script.
2 — Calculations:
• Calculate Extreme Shadow: Checks if the differences between certain SMAs and prices exceed predefined thresholds.
• Calculate Buy Extreme Shadow: Extends the logic by incorporating additional SMAs to identify stronger buy signals.
• Calculate Massive Bullish Sell: Detects massive bullish sell conditions using longer-term SMAs.
3 — Plotting:
• The script plots the calculated conditions using distinct colors to differentiate between various types of extreme shadows.
Data Flow:
• The close price is passed through each custom function.
• Each function computes its respective conditions based on specified SMAs and thresholds.
• The computed values are then summed and returned.
• Finally, the aggregated values are plotted on the chart using the plot function.
█ CUSTOM FUNCTIONS
1 — calculate_extreme_shadow(close)
• Purpose: Identify extreme shadow conditions based on 8-period and 14-period SMAs.
• Functionality: Computes the difference between the 8-period SMA and the close price, and the difference between the 14-period SMA and the 4-period SMA, relative to the 6-period SMA. Returns 2 if both conditions exceed 0.04; otherwise, returns 0.
• Parameters: close (price series)
• Return Value: Integer (0 or 2)
2 — calculate_buy_extreme_shadow(close)
• Purpose: Identify more robust buy signals by evaluating multiple SMAs.
• Functionality: Considers the 8-period SMA along with additional SMAs (21, 42, 63, 84, 105) and combines multiple conditions to provide a comprehensive buy signal.
• Parameters: close (price series)
• Return Value: Integer (sum of conditions, ranging from 0 to 14)
3 — calculate_massive_bullish_sell(close)
• Purpose: Detect massive bullish sell conditions using longer-term SMAs.
• Functionality: Evaluates conditions based on the 8-period SMA and longer-term SMAs (88, 44, 22, 11, 5), returning a sum of conditions meeting specified thresholds.
• Parameters: close (price series)
• Return Value: Integer (sum of conditions, ranging from 0 to 10)
█ KEY POINTS AND TECHNIQUES
• Advanced Pine Script Features:
• Multiple Nested Conditions: Uses nested conditions to assess complex market scenarios.
• Combination of Conditions: Combines multiple conditions to provide a more reliable signal.
• Optimization Techniques:
• Thresholds: Employs specific thresholds (0.04 and 0.03) to filter out noise and highlight significant market movements.
• SMA Comparisons: Compares multiple SMAs to identify trends and extreme conditions.
• Unique Approaches:
• Combining Multiple Time Frames: Incorporates multiple time frames to offer a holistic view of the market.
• Visual Distinction: Utilizes different colors and line widths to clearly differentiate between various extreme shadow conditions.
█ EXTENDED KNOWLEDGE AND APPLICATIONS
• Potential Modifications:
• User-Defined Thresholds: Allow users to customize thresholds to align with personal trading strategies.
• Additional Indicators: Integrate other technical indicators like RSI or MACD to improve the detection of extreme market conditions.
• Entry and Exit Signals: Enhance the script to generate clear buy and sell signals based on identified extreme shadow conditions.
• Application Scenarios:
• Volatility Analysis: Analyze market volatility and pinpoint times of extreme price action.
• Trend Following: Pair with trend-following strategies to capitalize on significant market moves.
• Risk Management: Adjust position sizes or stop-loss levels based on detected extreme conditions.
• Related Pine Script Concepts:
• Custom Functions: Demonstrates how to create reusable functions for simplified and organized code.
• Plotting Techniques: Shows effective ways to visualize data using color and styling options.
• Multiple Time Frame Analysis: Highlights the benefits of analyzing multiple time frames for a broader market understanding.
Prediction Based on Linreg & Atr
We created this algorithm with the goal of predicting future prices 📊, specifically where the value of any asset will go in the next 20 periods ⏳. It uses linear regression based on past prices, calculating a slope and an intercept to forecast future behavior 🔮. This prediction is then adjusted according to market volatility, measured by the ATR 📉, and the direction of trend signals, which are based on the MACD and moving averages 📈.
How Does the Linreg & ATR Prediction Work?
1. Trend Calculation and Signals:
o Technical Indicators: We use short- and long-term exponential moving averages (EMA), RSI, MACD, and Bollinger Bands 📊 to assess market direction and sentiment (not visually presented in the script).
o Calculation Functions: These include functions to calculate slope, average, intercept, standard deviation, and Pearson's R, which are crucial for regression analysis 📉.
2. Predicting Future Prices:
o Linear Regression: The algorithm calculates the slope, average, and intercept of past prices to create a regression channel 📈, helping to predict the range of future prices 🔮.
o Standard Deviation and Pearson's R: These metrics determine the strength of the regression 🔍.
3. Adjusting the Prediction:
o The predicted value is adjusted by considering market volatility (ATR 📉) and the direction of trend signals 🔮, ensuring that the prediction is aligned with the current market environment 🌍.
4. Visualization:
o Prediction Lines and Bands: The algorithm plots lines that display the predicted future price along with a prediction range (upper and lower bounds) 📉📈.
5. EMA Cross Signals:
o EMA Conditions and Total Score: A bullish crossover signal is generated when the total score is positive and the short EMA crosses above the long EMA 📈. A bearish crossover signal is generated when the total score is negative and the short EMA crosses below the long EMA 📉.
6. Additional Considerations:
o Multi-Timeframe Regression Channel: The script calculates regression channels for different timeframes (5m, 15m, 30m, 4h) ⏳, helping determine the overall market direction 📊 (not visually presented).
Confidence Interpretation:
• High Confidence (close to 100%): Indicates strong alignment between timeframes with a clear trend (bullish or bearish) 🔥.
• Low Confidence (close to 0%): Shows disagreement or weak signals between timeframes ⚠️.
Confidence complements the interpretation of the prediction range and expected direction 🔮, aiding in decision-making for market entry or exit 🚀.
Español
Creamos este algoritmo con el objetivo de predecir los precios futuros 📊, específicamente hacia dónde irá el valor de cualquier activo en los próximos 20 períodos ⏳. Utiliza regresión lineal basada en los precios pasados, calculando una pendiente y una intersección para prever el comportamiento futuro 🔮. Esta predicción se ajusta según la volatilidad del mercado, medida por el ATR 📉, y la dirección de las señales de tendencia, que se basan en el MACD y las medias móviles 📈.
¿Cómo Funciona la Predicción con Linreg & ATR?
Cálculo de Tendencias y Señales:
Indicadores Técnicos: Usamos medias móviles exponenciales (EMA) a corto y largo plazo, RSI, MACD y Bandas de Bollinger 📊 para evaluar la dirección y el sentimiento del mercado (no presentados visualmente en el script).
Funciones de Cálculo: Incluye funciones para calcular pendiente, media, intersección, desviación estándar y el coeficiente de correlación de Pearson, esenciales para el análisis de regresión 📉.
Predicción de Precios Futuros:
Regresión Lineal: El algoritmo calcula la pendiente, la media y la intersección de los precios pasados para crear un canal de regresión 📈, ayudando a predecir el rango de precios futuros 🔮.
Desviación Estándar y Pearson's R: Estas métricas determinan la fuerza de la regresión 🔍.
Ajuste de la Predicción:
El valor predicho se ajusta considerando la volatilidad del mercado (ATR 📉) y la dirección de las señales de tendencia 🔮, asegurando que la predicción esté alineada con el entorno actual del mercado 🌍.
Visualización:
Líneas y Bandas de Predicción: El algoritmo traza líneas que muestran el precio futuro predicho, junto con un rango de predicción (límites superior e inferior) 📉📈.
Señales de Cruce de EMAs:
Condiciones de EMAs y Puntaje Total: Se genera una señal de cruce alcista cuando el puntaje total es positivo y la EMA corta cruza por encima de la EMA larga 📈. Se genera una señal de cruce bajista cuando el puntaje total es negativo y la EMA corta cruza por debajo de la EMA larga 📉.
Consideraciones Adicionales:
Canal de Regresión Multi-Timeframe: El script calcula canales de regresión para diferentes marcos de tiempo (5m, 15m, 30m, 4h) ⏳, ayudando a determinar la dirección general del mercado 📊 (no presentado visualmente).
Interpretación de la Confianza:
Alta Confianza (cerca del 100%): Indica una fuerte alineación entre los marcos temporales con una tendencia clara (alcista o bajista) 🔥.
Baja Confianza (cerca del 0%): Muestra desacuerdo o señales débiles entre los marcos temporales ⚠️.
La confianza complementa la interpretación del rango de predicción y la dirección esperada 🔮, ayudando en las decisiones de entrada o salida en el mercado 🚀.

Adaptive Price Zone Oscillator [QuantAlgo]Adaptive Price Zone Oscillator 🎯📊
The Adaptive Price Zone (APZ) Oscillator by QuantAlgo is an advanced technical indicator designed to identify market trends and reversals through adaptive price zones based on volatility-adjusted bands. This sophisticated system combines typical price analysis with dynamic volatility measurements to help traders and investors identify trend direction, potential reversals, and market volatility conditions. By evaluating both price action and volatility together, this tool enables users to make informed trading decisions while adapting to changing market conditions.
💫 Dynamic Zone Architecture
The APZ Oscillator provides a unique framework for assessing market trends through a blend of smoothed typical prices and volatility-based calculations. Unlike traditional oscillators that use fixed parameters, this system incorporates dynamic volatility measurements to adjust sensitivity automatically, helping users determine whether price movements are significant relative to current market conditions. By combining smoothed price trends with adaptive volatility zones, it evaluates both directional movement and market volatility, while the smoothing parameters ensure stable yet responsive signals. This adaptive approach allows users to identify trending conditions while remaining aware of volatility expansions and contractions, enhancing both trend-following and mean-reversion strategies.
📊 Indicator Components & Mechanics
The APZ Oscillator is composed of several technical components that create a dynamic trending system:
Typical Price: Utilizes HLC3 (High, Low, Close average) as a balanced price representation
Volatility Measurement: Computes exponential moving average of price changes to determine dynamic zones
Smoothed Calculations: Applies additional smoothing to reduce noise while maintaining responsiveness
Trend Detection: Evaluates price position relative to adaptive zones to determine market direction
📈 Key Indicators and Features
The APZ Oscillator utilizes typical price with customizable length and threshold parameters to adapt to different trading styles. Volatility calculations are applied to determine zone boundaries, providing context-aware levels for trend identification. The trend detection component evaluates price action relative to the adaptive zones, helping validate trends and identify potential reversals.
The indicator also incorporates multi-layered visualization with:
Color-coded trend representation (bullish/bearish)
Clear trend state indicators (+1/-1)
Mean reversion signals with distinct markers
Gradient fills for better visual clarity
Programmable alerts for trend changes
⚡️ Practical Applications and Examples
✅ Add the Indicator : Add the indicator to your TradingView chart by clicking on the star icon to add it to your favorites ⭐️
👀 Monitor Trend State : Watch the oscillator's position relative to the zero line to identify trend direction and potential reversals. The step-line visualization with diamonds makes trend changes clearly visible.
🎯 Track Signals : Pay attention to the mean reversion markers that appear above and below the price chart:
→ Upward triangles (⤻) signal potential bullish reversals
→ X crosses (↷) indicate potential bearish reversals
🔔 Set Alerts : Configure alerts for trend changes in both bullish and bearish directions, ensuring you can act on significant technical developments promptly.
🌟 Summary and Tips
The Adaptive Price Zone Oscillator by QuantAlgo is a versatile technical tool, designed to support both trend following and mean reversion strategies across different market environments. By combining smoothed typical price analysis with dynamic volatility-based zones, it helps traders and investors identify significant trend changes while measuring market volatility, providing reliable technical signals. The tool's adaptability through customizable length, threshold, and smoothing parameters makes it suitable for various trading timeframes and styles, allowing users to capture opportunities while maintaining awareness of changing market conditions.
Key parameters to optimize for your trading style:
APZ Length: Adjust for more or less sensitivity to price changes
Threshold: Fine-tune the volatility multiplier for wider or narrower zones
Smoothing: Balance noise reduction with signal responsiveness

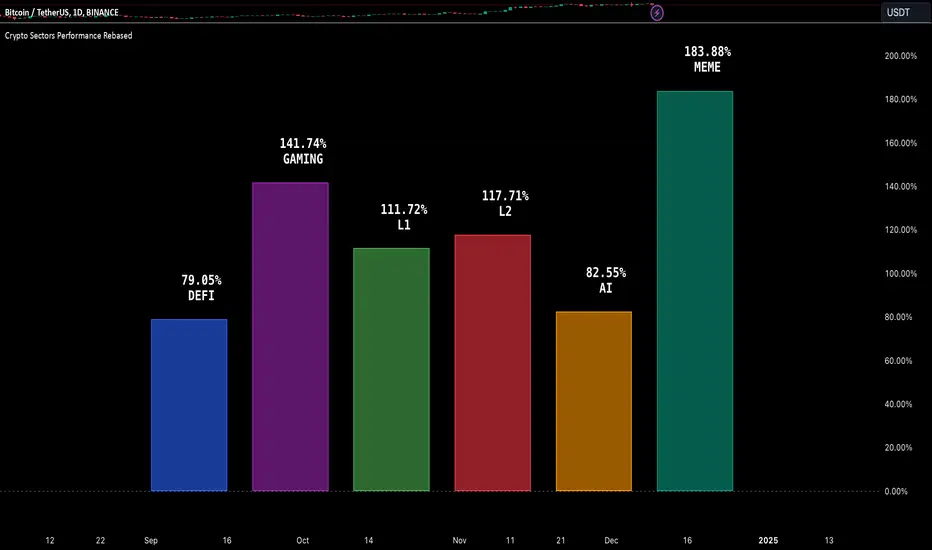
Crypto Sectors Performance [Daveatt]IMPORTANT
⚠️ This script must be used on the Daily timeframe only.
OVERVIEW
This indicator brings the powerful sector analysis capabilities from velo.xyz/market's
Sector Performance chart to TradingView.
It enables traders to track and compare performance across the crypto market's major sectors, providing essential insights for sector rotation strategies and market analysis.
CALCULATION METHOD
The indicator calculates performance across six key crypto sectors: DeFi, Gaming, Layer 1s, Layer 2s, AI, and Memecoins.
For each sector, it computes a rolling percentage performance by averaging the performance of multiple representative tokens.
All sector performances are rebased to 0% at the start of each period, making relative comparisons clear and intuitive.
VISUALIZATION MODES
The script features two distinct visualization methods:
Plots Mode:
Displays continuous performance lines for each sector over time, ideal for tracking relative strength trends and sector momentum. Each sector has its own color-coded line with performance values clearly marked.
Bars Mode:
Presents current sector performance as vertical bars, offering an immediate visual comparison of sector gains and losses.
The bars are color-coded and labeled with exact percentage values for precise analysis.
For the "Bars Mode", I used the box.new() function
SECTOR COMPOSITION
Each sector comprises carefully selected representative tokens:
- DeFi: AAVE, 1INCH, JUP, MKR, UNI
- Gaming: GALA, AXS, RONIN, SAND
- Layer 1: BTC, ETH, AVAX, APT, SOL, BNB, SUI
- Layer 2: ARB, OP, ZK, POL, STRK, MNT
- AI: FET, NEAR, RENDER, TAO
- Memecoins: PEPE, BONK, SHIB, DOGE, WIFU, POPCAT
PERFORMANCE TRACKING
The indicator implements a rolling window approach for performance calculations.
Starting from 0% at the beginning of each period, it tracks relative performance with positive values indicating outperformance and negative values showing underperformance.
Multiple timeframe options (1W, 1M, 3M, 6M, and 1Y) allow for both short-term and long-term analysis.
APPLICATIONS
This tool proves invaluable for:
- Sector rotation analysis
- Identifying trending sectors
- Comparing relative strength
- Gauging market sentiment
- Understanding market structure through sector performance
Thanks for reading and for the support
Daveatt
MSS and TrendLine'sTake action when a MSS is happening and close the trade when it breaks the trend line


Multi-Indicator Signal with TableThis indicator is a versatile multi-indicator tool designed for traders who want to combine signals from various popular indicators into a single framework. It not only visualizes buy and sell signals but also provides a clear, easy-to-read table that summarizes the included indicators and their respective signal colors.
Key Features:
RSI (Relative Strength Index):
Buy Signal: RSI falls below the oversold level (default: 30).
Sell Signal: RSI rises above the overbought level (default: 70).
Signal Color: Green.
MACD (Moving Average Convergence Divergence):
Buy Signal: MACD line crosses above the signal line.
Sell Signal: MACD line crosses below the signal line.
Signal Color: Blue.
MA Crossover (Moving Average Crossover):
Buy Signal: Short EMA (default: 7) crosses above Long SMA (default: 14).
Sell Signal: Short EMA crosses below Long SMA.
Signal Color: Purple.
Stochastic Oscillator:
Buy Signal: Stochastic %K falls below 20 and crosses above %D.
Sell Signal: Stochastic %K rises above 80 and crosses below %D.
Signal Color: Yellow.
TSI (True Strength Index):
Buy Signal: TSI crosses above the zero line.
Sell Signal: TSI crosses below the zero line.
Signal Color: Red.
Dynamic Signal Table:
A clean, compact table displayed at the top-right corner of the chart, summarizing the indicators and their respective signal colors for quick reference.
Customization:
All indicator parameters are fully adjustable, allowing users to fine-tune settings to match their trading strategy.
Signal colors and table design ensure a visually intuitive experience.
Usage:
This tool is ideal for traders who prefer a multi-indicator approach for generating buy/sell signals.
The combination of different indicators helps to filter out noise and increase the accuracy of trade setups.
Notes:
Signals appear only after the confirmation of the current bar to avoid false triggers.
This indicator is designed for educational purposes and should be used in conjunction with proper risk management strategies.

Double EMA 9-15 & Chandelier Exit v.02Strategy Description: EMA Pullback Strategy with Chandelier Confirmation v0.2
This strategy combines a short-term EMA pullback setup with confirmation from the Chandelier Exit indicator. The goal is to capture pullbacks in trending markets and confirm their validity using volatility-based stops.
EMA 9-15 Pullback Logic:
The script calculates two EMAs (Exponential Moving Averages) of periods 9 and 15.
A buy signal is generated when:
The price pulls back and closes above the 9 EMA.
The 9 EMA remains above the 15 EMA, confirming an upward trend.
A sell signal is generated under similar conditions in the opposite direction.
Chandelier Exit Confirmation:
The Chandelier Exit is calculated using the ATR (Average True Range) to identify dynamic trailing stops.
A signal is confirmed only if the Chandelier Exit agrees with the EMA pullback setup:
For long signals, the price should be above the Chandelier's trailing stop for longs.
For short signals, the price should be below the Chandelier's trailing stop for shorts.
Additional Features:
45-90 EMA are implemented as secondary indicators for further analysis and this ema used as next time frame 9 and 15 ema
.RSI Divergence can add for more confirmation and
This setup is ideal for traders looking to capitalize on retracements within trending markets while using robust confirmation methods to filter false signals.
Disclaimer:
This script is intended for informational and educational purposes only. It combines multiple technical analysis tools, including EMA pullback signals, RSI divergence, Chandelier Exit, and 4 EMA crossovers, to assist traders in identifying potential trading opportunities.
Key Notes:
Past performance of any strategy or indicator is not indicative of future results.
This script does not provide financial, investment, or trading advice. Users are responsible for conducting their own analysis and decision-making.
The effectiveness of this strategy may vary based on market conditions, and it should be used in conjunction with proper risk management and additional confirmation tools.
Always test strategies on historical data and paper trading environments before deploying them in live markets.
By using this script, you acknowledge and accept that trading involves significant risks and may result in the loss of your invested capital. Consult with a financial professional if you are unsure about your trading or investment decisions.

Multi Timeframe EMA Crossover [BigS]Version 1.2 Dec 11, 2024
This indicator lets the user customize the EMA Moving Average crossover pair desired, and select Nine Time periods for that pair. It will show each time period as bullish (green) or bearish (red) cells.
Default EMA is 5 & 9.
1.1 Changed color layout, and made the width of the columns smaller. Added in Table Position & Size options under "Settings", but not active yet.
1.2 Made source open


Swing High/Low Pivots Strategy [LV]The Swing High/Low Pivots Strategy was developed as a counter-momentum trading tool.
The strategy is suitable for any market and its default input values are set to fit BTC 15min.
Check tooltips in the settings menu for more details about user inputs.
Trades Entry based on the detection of swing highs and lows for short and long entries respectively, validated by:
Limit orders placed after each new pivot level confirmation
Moving averages trend filter (if enabled)
No active trade
Trades Exit when the price reaches take-profit or stop-loss level as defined in the settings menu. A double entry/second take-profit level can be enabled for partial exits, with dynamic stop-loss adjustment for the remaining position.
Swing High/Low Pivot Detection
Employs ta.pivothigh and ta.pivotlow to detect higher highs (HH), lower highs (LH), higher lows (HL), and lower lows (LL).
Trend Filter
Integrates a moving average filter to validate trade entries based on the current trend observed at Pivot. Supports multiple moving average types, including EMA, SMA, WMA, HMA, VWMA, VWAP, and more.
Alerts
Configurable alert messages are suitable for API use.
Visuals
Moving average
Pivot markers
Limit lines
Stop-loss
Take-profit
Any feedback, comments, or suggestions for improvement are always welcome.
Hope you enjoy ;)

Trend Condition [TradersPro]
OVERVIEW
The Trend Condition Indicator measures the strength of the bullish or bearish trend by using a ribbon pattern of exponential moving averages and scoring system. Trend cycles naturally expand and contract as a normal part of the cycle. It is the rhythm of the market. Perpetual expansion and contraction of trend.
As trend cycles develop the indicator shows a compression of the averages. These compression zones are key locations as trends typically expand from there. The expansion of trend can be up or down.
As the trend advances the ribbon effect of the indicator can be seen as each average expands with the price action. Once they have “fanned” the probability of the current trend slowing is high.
This can be used to recognize a powerful trend may be concluding. Traders can tighten stops, exit positions or utilize other prudent strategies.
CONCEPTS
Each line will display green if it is higher than the prior period and red if it is lower than the prior period. If the average is green it is considered bullish and will score one point in the bullish display. Red lines are considered bearish and will score one point in the bearish display.
The indicator can then be used at a quick glance to see the number of averages that are bullish and the number that are bearish.
A trader may use these on any tradable instrument. They can be helpful in stock portfolio management when used with an index like the S&P 500 to determine the strength of the current market trend. This may affect trade decisions like possession size, stop location and other risk factors.

300-Candle Weighted Average Zones w/50 EMA SignalsThis indicator is designed to deliver a more nuanced view of price dynamics by combining a custom, weighted price average with a volatility-based zone and a trend filter (in this case, a 50-period exponential moving average). The core concept revolves around capturing the overall price level over a relatively large lookback window (300 candles) but with an intentional bias toward recent market activity (the most recent 20 candles), thereby offering a balance between long-term context and short-term responsiveness. By smoothing this weighted average and establishing a “zone” of standard deviation bands around it, the indicator provides a refined visualization of both average price and its recent volatility envelope. Traders can then look for confluence with a standard trend filter, such as the 50 EMA, to identify meaningful crossover signals that may represent trend shifts or opportunities for entry and exit.
What the Indicator Does:
Weighted Price Average:
Instead of using a simple or exponential moving average, this indicator calculates a custom weighted average price over the past 300 candles. Most historical candles receive a base weight of 1.0, but the most recent 20 candles are assigned a higher weight (for example, a weight of 2.0). This weighting scheme ensures that the calculation is not simply a static lookback average; it actively emphasizes current market conditions. The effect is to generate an average line that is more sensitive to the most recent price swings while still maintaining the historical context of the previous 280 candles.
Smoothing of the Weighted Average:
Once the raw weighted average is computed, an exponential smoothing function (EMA) is applied to reduce noise and produce a cleaner, more stable average line. This smoothing helps traders avoid reacting prematurely to minor price fluctuations. By stabilizing the average line, traders can more confidently identify actual shifts in market direction.
Volatility Zone via Standard Deviation Bands:
To contextualize how far price can deviate from this weighted average, the indicator uses standard deviation. Standard deviation is a statistical measure of volatility—how spread out the price values are around the mean. By adding and subtracting one standard deviation from the smoothed weighted average, the indicator plots an upper band and a lower band, creating a zone or channel. The area between these bands is filled, often with a semi-transparent color, highlighting a volatility corridor within which price and the EMA might oscillate.
This zone is invaluable in visualizing “normal” price behavior. When the 50 EMA line and the weighted average line are both within this volatility zone, it indicates that the market’s short- to mid-term trend and its average pricing are aligned well within typical volatility bounds.
Incorporation of a 50-Period EMA:
The inclusion of a commonly used trend filter, the 50 EMA, adds another layer of context to the analysis. The 50 EMA, being a widely recognized moving average length, is often considered a baseline for intermediate trend bias. It reacts faster than a long-term average (like a 200 EMA) but is still stable enough to filter out the market “chop” seen in very short-term averages.
By overlaying the 50 EMA on this custom weighted average and the surrounding volatility zone, the trader gains a dual-dimensional perspective:
Trend Direction: If the 50 EMA is generally above the weighted average, the short-term trend is gaining bullish momentum; if it’s below, the short-term trend has a bearish tilt.
Volatility Normalization: The bands, constructed from standard deviations, provide a sense of whether the price and the 50 EMA are operating within a statistically “normal” range. If the EMA crosses the weighted average within this zone, it signals a potential trend initiation or meaningful shift, as opposed to a random price spike outside normal volatility boundaries.
Why a Trader Would Want to Use This Indicator:
Contextualized Price Level:
Standard MAs may not fully incorporate the most recent price dynamics in a large lookback window. By weighting the most recent candles more heavily, this indicator ensures that the trader is always anchored to what the market is currently doing, not just what it did 100 or 200 candles ago.
Reduced Whipsaw with Smoothing:
The smoothed weighted average line reduces noise, helping traders filter out inconsequential price movements. This makes it easier to spot genuine changes in trend or sentiment.
Visual Volatility Gauge:
The standard deviation bands create a visual representation of “normal” price movement. Traders can quickly assess if a breakout or breakdown is statistically significant or just another oscillation within the expected volatility range.
Clear Trade Signals with Confirmation:
By integrating the 50 EMA and designing signals that trigger only when the 50 EMA crosses above or below the weighted average while inside the zone, the indicator provides a refined entry/exit criterion. This avoids chasing breakouts that occur in abnormal volatility conditions and focuses on those crossovers likely to have staying power.
How to Use It in an Example Strategy:
Imagine you are a swing trader looking to identify medium-term trend changes. You apply this indicator to a chart of a popular currency pair or a leading tech stock. Over the past few days, the 50 EMA has been meandering around the weighted average line, both confined within the standard deviation zone.
Bullish Example:
Suddenly, the 50 EMA crosses decisively above the weighted average line while both are still hovering within the volatility zone. This might be your cue: you interpret this crossover as the 50 EMA acknowledging the recent upward shift in price dynamics that the weighted average has highlighted. Since it occurred inside the normal volatility range, it’s less likely to be a head-fake. You place a long position, setting an initial stop just below the lower band to protect against volatility.
If the price continues to rise and the EMA stays above the average, you have confirmation to hold the trade. As the price moves higher, the weighted average may follow, reinforcing your bullish stance.
Bearish Example:
On the flip side, if the 50 EMA crosses below the weighted average line within the zone, it suggests a subtle but meaningful change in trend direction to the downside. You might short the asset, placing your protective stop just above the upper band, expecting that the statistically “normal” level of volatility will contain the price action. If the price does break above those bands later, it’s a sign your trade may not work out as planned.
Other Indicators for Confluence:
To strengthen the reliability of the signals generated by this weighted average zone approach, traders may want to combine it with other technical studies:
Volume Indicators (e.g., Volume Profile, OBV):
Confirm that the trend crossover inside the volatility zone is supported by volume. For instance, an uptrend crossover combined with increasing On-Balance Volume (OBV) or volume spikes on up candles signals stronger buying pressure behind the price action.
Momentum Oscillators (e.g., RSI, Stochastics):
Before taking a crossover signal, check if the RSI is above 50 and rising for bullish entries, or if the Stochastics have turned down from overbought levels for bearish entries. Momentum confirmation can help ensure that the trend change is not just an isolated random event.
Market Structure Tools (e.g., Pivot Points, Swing High/Low Analysis):
Identify if the crossover event coincides with a break of a previous pivot high or low. A bullish crossover inside the zone aligned with a break above a recent swing high adds further strength to your conviction. Conversely, a bearish crossover confirmed by a breakdown below a previous swing low can make a short trade setup more compelling.
Volume-Weighted Average Price (VWAP):
Comparing where the weighted average zone lies relative to VWAP can provide institutional insight. If the bullish crossover happens while the price is also holding above VWAP, it can mean that the average participant in the market is in profit and that the trend is likely supported by strong hands.
This indicator serves as a tool to balance long-term perspective, short-term adaptability, and volatility normalization. It can be a valuable addition to a trader’s toolkit, offering enhanced clarity and precision in detecting meaningful shifts in trend, especially when combined with other technical indicators and robust risk management principles.
Linear Regression Candles with AlertsLinear Regression Candles with Alerts. This is only for testing, nothing else. Don't use it

NİXCORVUS V.8.1fsdfsgdfgsedgrehyrtjgukfhukersdghtrfgyhkuçıhjbhgjhesdhfjmöjkhkjsyeagshjgkççl.hgydryseyrhjöb
