OPEN-SOURCE SCRIPT
BB phases

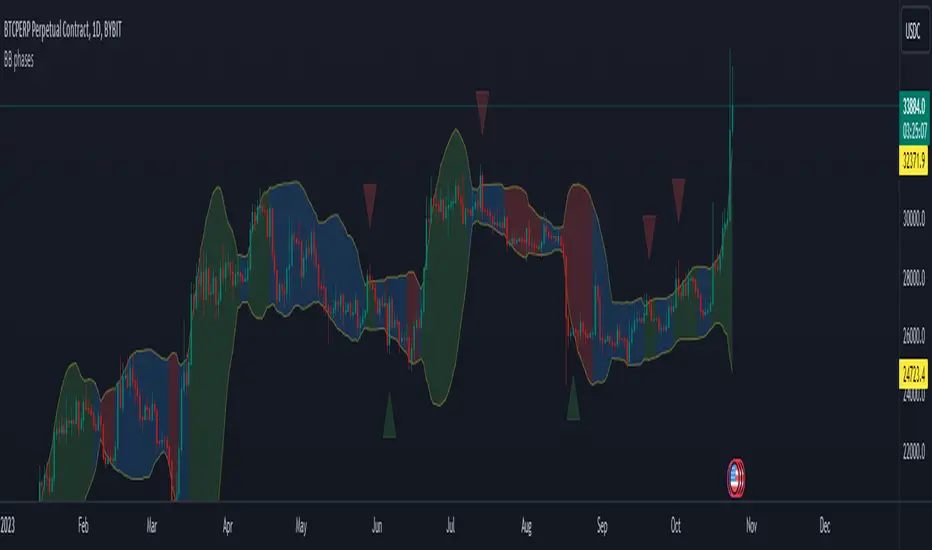
This indicator is designed to visually represent different market phases based on Bollinger Bands (BB) and provide insights into potential bullish and bearish signals. Let's break down what the indicator does:
The indicator smoothly transitions from the "squeeze" phase to "bullish" or "bearish" phases based on specific price conditions. Here's a more detailed explanation of how this transition occurs:
Another feature of the indicator is to display bearish/bullish triangles when the price reintegrate the bollinger bands after it previously breaked it. For example if the price closes below the lower BB and then the next candle in above the lower BB, a bullish triangle will be displayed.
The indicator smoothly transitions from the "squeeze" phase to "bullish" or "bearish" phases based on specific price conditions. Here's a more detailed explanation of how this transition occurs:
- Squeeze Phase: The "squeeze" phase is identified when the closing price is within the range between the upper Bollinger Band (upper BB) and the lower Bollinger Band (lower BB).
- Transition to Bullish Phase: The transition from "squeeze" to "bullish" phase occurs when the price closes above the upper BB. The bullish phase will last while the price hasn't closed below the middle BB.
- Transition to Bearish Phase: Conversely, the transition from "squeeze" to "bearish" phase occurs when the price closes below the lower BB. The bearish phase will last while the price hasn't closed above the middle BB.
Another feature of the indicator is to display bearish/bullish triangles when the price reintegrate the bollinger bands after it previously breaked it. For example if the price closes below the lower BB and then the next candle in above the lower BB, a bullish triangle will be displayed.
开源脚本
秉承TradingView的精神,该脚本的作者将其开源,以便交易者可以查看和验证其功能。向作者致敬!您可以免费使用该脚本,但请记住,重新发布代码须遵守我们的网站规则。
免责声明
这些信息和出版物并非旨在提供,也不构成TradingView提供或认可的任何形式的财务、投资、交易或其他类型的建议或推荐。请阅读使用条款了解更多信息。
开源脚本
秉承TradingView的精神,该脚本的作者将其开源,以便交易者可以查看和验证其功能。向作者致敬!您可以免费使用该脚本,但请记住,重新发布代码须遵守我们的网站规则。
免责声明
这些信息和出版物并非旨在提供,也不构成TradingView提供或认可的任何形式的财务、投资、交易或其他类型的建议或推荐。请阅读使用条款了解更多信息。