OPEN-SOURCE SCRIPT
Window Periods
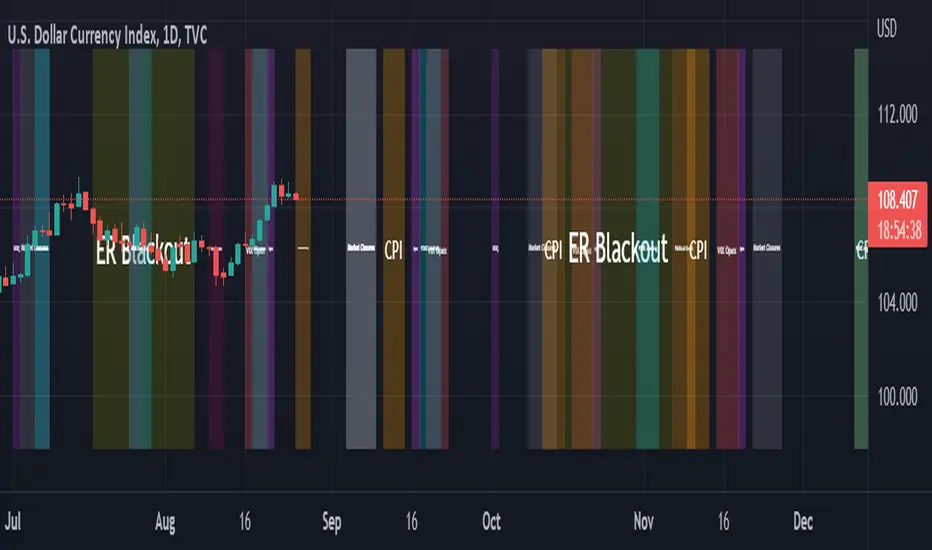
// Work in progress.. visualize event windows
// to do:
// - assign sector relevance (add opec events and weight more to commodity typed instruments, whereas revenue forecasts of walmart won't be as relevant to commodities)
// - create weighting onto macro probability valuators
// - create means to store window weight/values in an accessible way so that additional scripts can access this data (post hidden text in window?) or maybe just duplicate arrays elsewhere in additional code (terrible option)
// - correct colors to scale within like types of events (opex the same, rebalancing periods the same, political and financial meeting the same color etc..)
// - find a way to make transfer the timestamps or date strings as const variables usable within functions. v5 sends as series and cannot be converted back making this an overly complicated case instead of a function/library
// - add dates back to 2017 for better referencing
// - convert a number of the variables to inputs so they can be controlled in-chart, such as transparancy, and color of each window period?
开源脚本
秉承TradingView的精神,该脚本的作者将其开源,以便交易者可以查看和验证其功能。向作者致敬!您可以免费使用该脚本,但请记住,重新发布代码须遵守我们的网站规则。
Tilden
免责声明
这些信息和出版物并非旨在提供,也不构成TradingView提供或认可的任何形式的财务、投资、交易或其他类型的建议或推荐。请阅读使用条款了解更多信息。
开源脚本
秉承TradingView的精神,该脚本的作者将其开源,以便交易者可以查看和验证其功能。向作者致敬!您可以免费使用该脚本,但请记住,重新发布代码须遵守我们的网站规则。
Tilden
免责声明
这些信息和出版物并非旨在提供,也不构成TradingView提供或认可的任何形式的财务、投资、交易或其他类型的建议或推荐。请阅读使用条款了解更多信息。