OPEN-SOURCE SCRIPT
已更新 BANKNIFTY list of stocks RSI trend on multi time frame
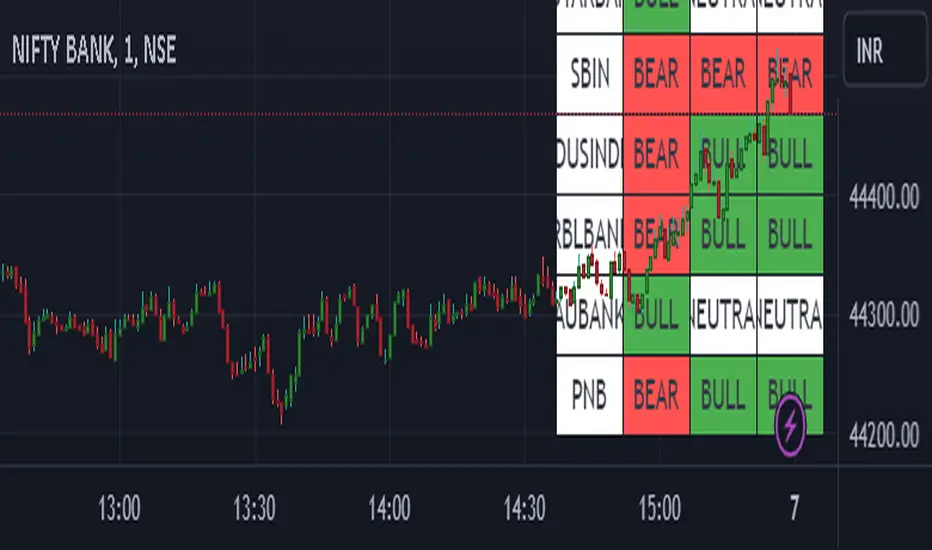
This script gives you an overview of banknifty and its underlying heavy weight stocks based on RSI
You can view the trend in single chart in 3 different time frames.
Color indication green for bullish and red for bearish trend and white for neutral
Symbol name shows green if the current day change is positive. Else red color
You can view the trend in single chart in 3 different time frames.
Color indication green for bullish and red for bearish trend and white for neutral
Symbol name shows green if the current day change is positive. Else red color
版本注释
Few users reported that the change of time is not reflecting correctly.Also removed the color for the first column as there was a restriction from TV
Enjoy the script
开源脚本
秉承TradingView的精神,该脚本的作者将其开源,以便交易者可以查看和验证其功能。向作者致敬!您可以免费使用该脚本,但请记住,重新发布代码须遵守我们的网站规则。
免责声明
这些信息和出版物并非旨在提供,也不构成TradingView提供或认可的任何形式的财务、投资、交易或其他类型的建议或推荐。请阅读使用条款了解更多信息。
免责声明
这些信息和出版物并非旨在提供,也不构成TradingView提供或认可的任何形式的财务、投资、交易或其他类型的建议或推荐。请阅读使用条款了解更多信息。