OPEN-SOURCE SCRIPT
Prometheus Analytics Hurst Exponent
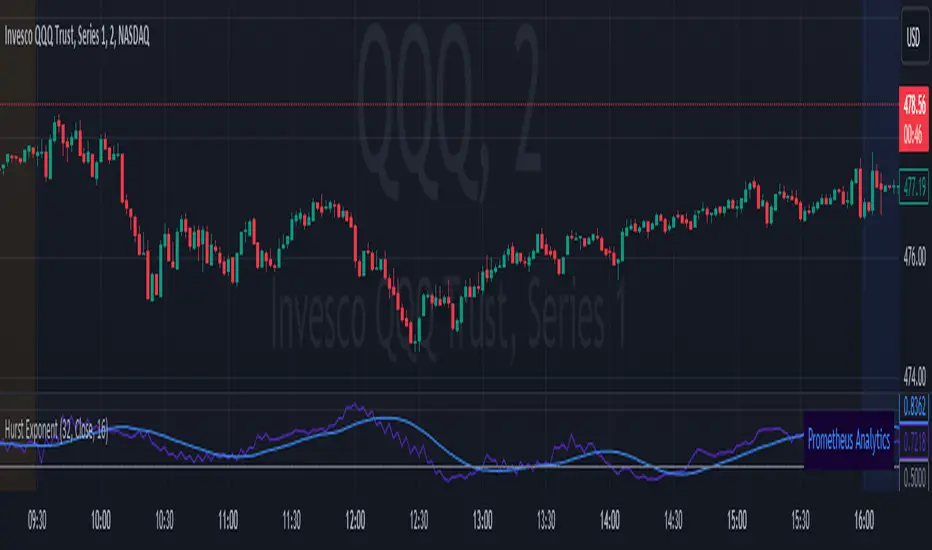
This indicator uses market data to calculate the Hurst Exponent so traders can have knowledge of the long memory of the asset.
Users can control the lookback length for the H value (Hurst Exponent), lookback length for the SMA (Simple Moving Average) of the Hurst Exponent, to show either, and what to calculate the H value and SMA on.
Hurst Exponent:
The Hurst Exponent is a value between 0 and 1 with 0.5 as a midline.
An H value(Hurst Exponent) above 0.5 indicates a trending market, and a market that should have larger, longer moves.
An H value below 0.5 indicates a mean reverting market, and a market that should have smaller, shorter moves.
An H value of0.5 indicates a random walk. This would mean the price would follow a Brownian Motion model and future prices would be independent from past prices.
Just because the H value is above 0.5 does not indicate that there should be an UP trend, just as a value below 0.5 does not indicate a DOWN trend. It indicates that there should be a trend, up or down.
Scenarios:
An intuitive way to use the Hurst Exponent is as an asset is trending in whatever direction, as the H value crosses below 0.5 it indicates a reversal. It indicates that what was happening before isn’t impacting what is happening now as much.
https://www.tradingview.com/x/GY96qKiY/
Steps explained from picture:
Step 1: Strong uptrend is identified with the asset moving up aggressively with H above 0.5.
Step 2: The H value crosses below 0.5 and prices stay elevated.
Step 3: Price reverts back down as the H value stays below 0.5
Just because the H value is above 0.5 doesn’t mean the asset has to be uptrending. In this example we see the asset fall as the H value is above 0.5. Not only that, but every time it crosses below 0.5, the asset takes a breather on the way down
https://www.tradingview.com/x/8RfKldWN/
Step 1: As the H value crosses above 0.5, we can expect trends to appear in the asset.
Step 2: After the trend switches to down, we only see a breather and some chop after the H value crosses back below 0.5.
Step 3: Once The H value crosses back over we see the downtrend continue and new lows be made.
Step 4: We see it once again, simply the area of chop is bigger. We don’t see a higher high, breaking the overall downtrend, but once the H value crosses over again the downturn continues and we see a lower low.
It may occur when no strong trend is made in either direction. The H value above 0.5 does indeed sometimes correlate with an uptrend sometimes.
https://www.tradingview.com/x/2QEGhCes/
Step 1: After the strong downtrend we see a break below 0.5 with some consolidation.
Step 2: No clear big move on the asset or H value.
Step 3: H value above 0.5 leads to a break of highs and a new uptrend.
Users have the option to decide what to calculate the H value on. Close is the default, or dollar return per bar are the options. Dollar return per bar and offer an H value that may give a better indication of when price moves will be small and sporadic.
Using dollar move per bar.
https://www.tradingview.com/x/2QEGhCes/
Step 1: H value cross above 0.5, we see large candles and fast moves.
Step 2: H value crosses below 0.5, the candles immediately following are shorter. The big red candles come right before the cross back above.
Step 3: H value cross back above 0.5, after some chop, large move down.
https://www.tradingview.com/x/sAclHfsc/
Similar story
Step 1: H value above 0.5, big trends either direction
Step 2: After the H value crosses below, the moves are short and choppy.
Settings:
Options to show or remove either the H value or it’s SMA.
Options to adjust the period uses, default is (32, 16)
开源脚本
秉承TradingView的精神,该脚本的作者将其开源,以便交易者可以查看和验证其功能。向作者致敬!您可以免费使用该脚本,但请记住,重新发布代码须遵守我们的网站规则。
免责声明
这些信息和出版物并非旨在提供,也不构成TradingView提供或认可的任何形式的财务、投资、交易或其他类型的建议或推荐。请阅读使用条款了解更多信息。
开源脚本
秉承TradingView的精神,该脚本的作者将其开源,以便交易者可以查看和验证其功能。向作者致敬!您可以免费使用该脚本,但请记住,重新发布代码须遵守我们的网站规则。
免责声明
这些信息和出版物并非旨在提供,也不构成TradingView提供或认可的任何形式的财务、投资、交易或其他类型的建议或推荐。请阅读使用条款了解更多信息。