OPEN-SOURCE SCRIPT
BBImpulse Indicator
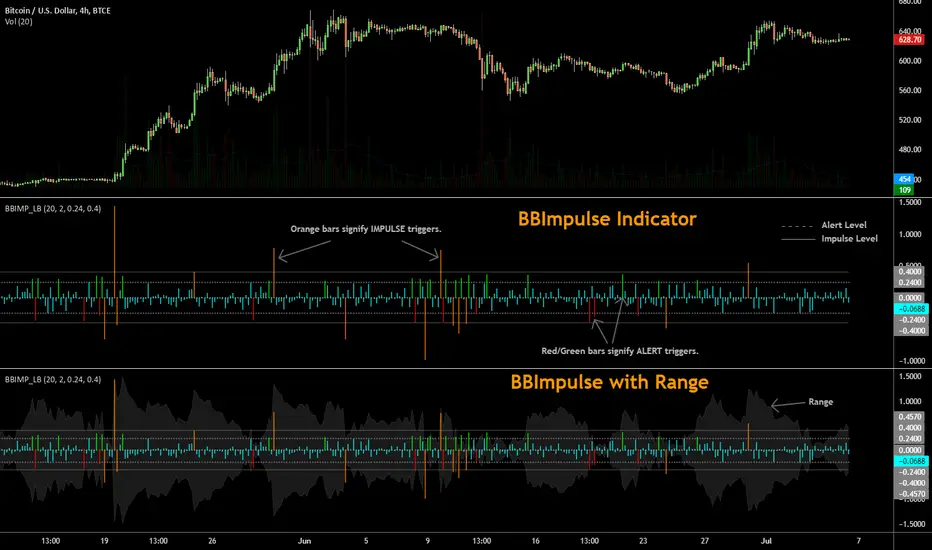
BBImpulse is part of the latest indicators package offered by John Bollinger. Excerpt from their market blurb (bbforex.com/tutorial/?p=4):
"BBImpulse is derived from %b. Its value is the periodic change of %b, so if %b was 0.45 this period and 0.20 last period the present value of BBImpulse is 0.25. We present two reference levels on the chart, an alert level and an impulse level."
"Generally the market moves in the direction of the latest alerts and/or impulses except towards the end of a move where one can take advantage of exhaustion/reversal signals from this indicator."
"Ian Woodward employs BBImpulse for his Kahuna signals using key levels of 0.24 and 0.40."
I added support for the following:
- Highlighting alert/impulse trigger bars
- Rendering the range (check options page).
I noticed that the range, by itself, highlights lot of info:
- Tapering in (narrowing) of range may signify topping or falling prices.
- Tapering out (expanding) may signify nearing a bottom or rising prices.
- Range getting "ranged" between alert or impulse levels signify a major move in the direction of the last impulse trigger. I think for this, alert level ranging intensity is greater than impulse level ranging intensity.
Someone more familiar with BB will have more observations, I am sure. Please do share here so we BB noobs can learn :)
For more indicators, check out my complete list here:
tradingview.com/v/4IneGo8h/
开源脚本
秉承TradingView的精神,该脚本的作者将其开源,以便交易者可以查看和验证其功能。向作者致敬!您可以免费使用该脚本,但请记住,重新发布代码须遵守我们的网站规则。
List of my free indicators: bit.ly/1LQaPK8
List of my indicators at Appstore: blog.tradingview.com/?p=970
List of my indicators at Appstore: blog.tradingview.com/?p=970
免责声明
这些信息和出版物并非旨在提供,也不构成TradingView提供或认可的任何形式的财务、投资、交易或其他类型的建议或推荐。请阅读使用条款了解更多信息。