OPEN-SOURCE SCRIPT
已更新 MTF Phoenix Table
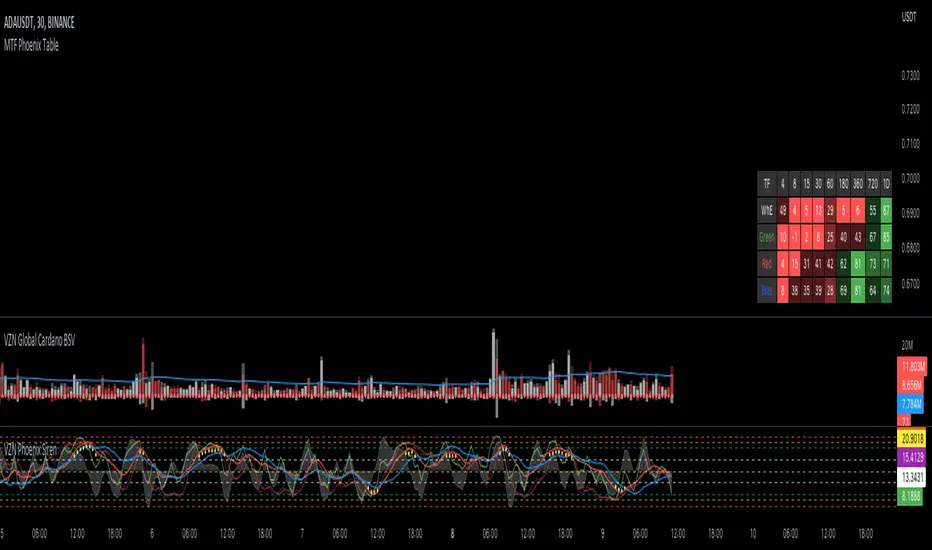
This is a MTF heatmap companion for the Phoenix Ascending indicator by WyckoffMode. It aims to make MTF analysis easier at a quick glance.
The row headings are color coordinated for easy visual recognition.
The row headings are color coordinated for easy visual recognition.
版本注释
I have updated the table so that if a Phoenix Indicator Value in any time frame is currently trending down (relative to the previous bar) the text color in that cell will be fuchsia. Also I made a slight adjustment to two transparency levels for < 50 to help distinguish between them.
版本注释
I reverted the text color change because it seems to have a bug. When the current chart timeframe is higher than the minimum timeframe in the table it doesn't always correctly call if the cell value is rising or falling.版本注释
I was able to discover a fix so the table updated correctly and color the text correctly based on if the current cell value was less than the previous value. The text color that represents a descending value is yellow.版本注释
Cell text color error removed版本注释
As requested by some, I have adjusted the code so that the timeframes in the settings are adjustable and effect the TF header accordingly. All values under the daily will be expressed in minutes, e.g. 12H = 720.开源脚本
秉承TradingView的精神,该脚本的作者将其开源,以便交易者可以查看和验证其功能。向作者致敬!您可以免费使用该脚本,但请记住,重新发布代码须遵守我们的网站规则。
免责声明
这些信息和出版物并非旨在提供,也不构成TradingView提供或认可的任何形式的财务、投资、交易或其他类型的建议或推荐。请阅读使用条款了解更多信息。
免责声明
这些信息和出版物并非旨在提供,也不构成TradingView提供或认可的任何形式的财务、投资、交易或其他类型的建议或推荐。请阅读使用条款了解更多信息。