OPEN-SOURCE SCRIPT
已更新 HEX Risk Metric (v0.2)
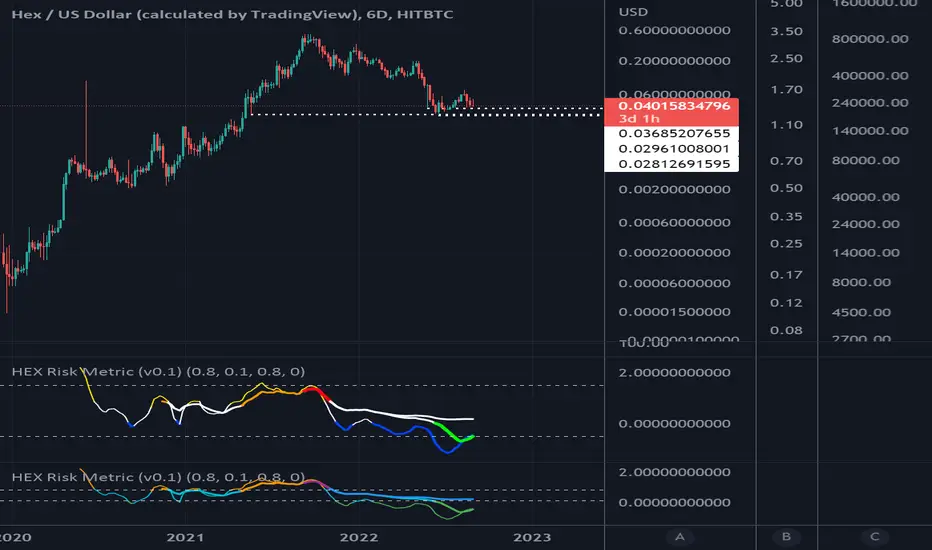
This indicator plots a "risk metric" based on the % increases of the following averages:
ema21, sma50, sma100, sma200, sma300, sma600.
Depending on the rolling 7-day percentage increase of this moving average, a value is assigned to each data point, then normalized to a common range.
This set of metrics attempts to represent data similar to that of a heat map.
Users can adjust filter top, filter bottom, and toggle on/off the different metrics within the set.
版本注释
Better colors for signals开源脚本
秉承TradingView的精神,该脚本的作者将其开源,以便交易者可以查看和验证其功能。向作者致敬!您可以免费使用该脚本,但请记住,重新发布代码须遵守我们的网站规则。
免责声明
这些信息和出版物并非旨在提供,也不构成TradingView提供或认可的任何形式的财务、投资、交易或其他类型的建议或推荐。请阅读使用条款了解更多信息。
免责声明
这些信息和出版物并非旨在提供,也不构成TradingView提供或认可的任何形式的财务、投资、交易或其他类型的建议或推荐。请阅读使用条款了解更多信息。