INVITE-ONLY SCRIPT
已更新 VR Crayons (Signals, Trend and Reversal Indicator)
This indicator is a combination of many different basic technical analysis tools, such as RSI, Bollinger Bands, Moving Averages and others.
It's main goal is to provide a fast and reliable visual representation of the current price action and possible entry and exit points for trades.
Explanation of the individual functions:
The indicator includes 2 different functions:
1) The crayons (colors of the candles) show the current state of price action and trend
and can be used to find oversold or overbought areas as well price reversal points.
The colors can be turned off and/or changed in the settings.
2) The signals that can be used to enter or exit trades. There are 4 different types of signals:
Mini signals, high/low timeframe signals and special signals.
All of them can be turned on and off in the settings.
Further explanations
Crayons:
There are 3 general colors, gray, green and red.
There are also multiple other colors to visualize special situations:
Lastly there are two special candle colors, dark red and light blue.
Those are volume weighted indicators of heavy dumping/pumping. I implemented them to signal higher than
average volume which dan be useful when looking for breakouts/-downs or to avoid fomoing into huge pumps or dumps
Signals:
As mentioned above, there are 4 different signal categories.
Signals for Lower Timeframes (5-30m) and Higher Timeframes (1h-D), special signals working on all timeframes
and mini signals which can be taken as TP points but also as entry points for trades.
The placement of the signals shows if it's a "BUY" (below the candles) or a "SELL" (above the candles).
Even-though signals are named "LTF signals", from my experience they can be used on all timeframes.
HTF signals do not work as good on lower timeframes.
For the best visualisation, disable candle borders in settings and turn the wick color to gray.
!! DISCLAIMER !!
All of these signals and bar colors are just visual helpers to find possible entry and exit points for your trades
and to get a quick overview of the current market conditions.
I would always recommend to use at least some basic technical analysis in combination.
And as always in trading, please use proper risk management! None of these signals can an will be 100% accurate!
!! All of these signals and colors are only valid AFTER candle close !!
!! This indicator is NOT repainting !!
Please don't use the comment section to ask for access to this indicator, you can always write me a PM.


It's main goal is to provide a fast and reliable visual representation of the current price action and possible entry and exit points for trades.
Explanation of the individual functions:
The indicator includes 2 different functions:
1) The crayons (colors of the candles) show the current state of price action and trend
and can be used to find oversold or overbought areas as well price reversal points.
The colors can be turned off and/or changed in the settings.
2) The signals that can be used to enter or exit trades. There are 4 different types of signals:
Mini signals, high/low timeframe signals and special signals.
All of them can be turned on and off in the settings.
Further explanations
Crayons:
There are 3 general colors, gray, green and red.
- Red signals a general downtrend,
- Green a general uptrend,
- Gray sideways action.
There are also multiple other colors to visualize special situations:
- Blue signals overbought areas
- Orange signals oversold areas
- Yellow and purple signalling heavy oversold areas and a possible trend reversal to the upside
- Dark Green signals heavy overbought areas and a possible trend reversal to the downside (Also marked with "R")
Lastly there are two special candle colors, dark red and light blue.
Those are volume weighted indicators of heavy dumping/pumping. I implemented them to signal higher than
average volume which dan be useful when looking for breakouts/-downs or to avoid fomoing into huge pumps or dumps
Signals:
As mentioned above, there are 4 different signal categories.
Signals for Lower Timeframes (5-30m) and Higher Timeframes (1h-D), special signals working on all timeframes
and mini signals which can be taken as TP points but also as entry points for trades.
The placement of the signals shows if it's a "BUY" (below the candles) or a "SELL" (above the candles).
Even-though signals are named "LTF signals", from my experience they can be used on all timeframes.
HTF signals do not work as good on lower timeframes.
For the best visualisation, disable candle borders in settings and turn the wick color to gray.
!! DISCLAIMER !!
All of these signals and bar colors are just visual helpers to find possible entry and exit points for your trades
and to get a quick overview of the current market conditions.
I would always recommend to use at least some basic technical analysis in combination.
And as always in trading, please use proper risk management! None of these signals can an will be 100% accurate!
!! All of these signals and colors are only valid AFTER candle close !!
!! This indicator is NOT repainting !!
Please don't use the comment section to ask for access to this indicator, you can always write me a PM.
版本注释
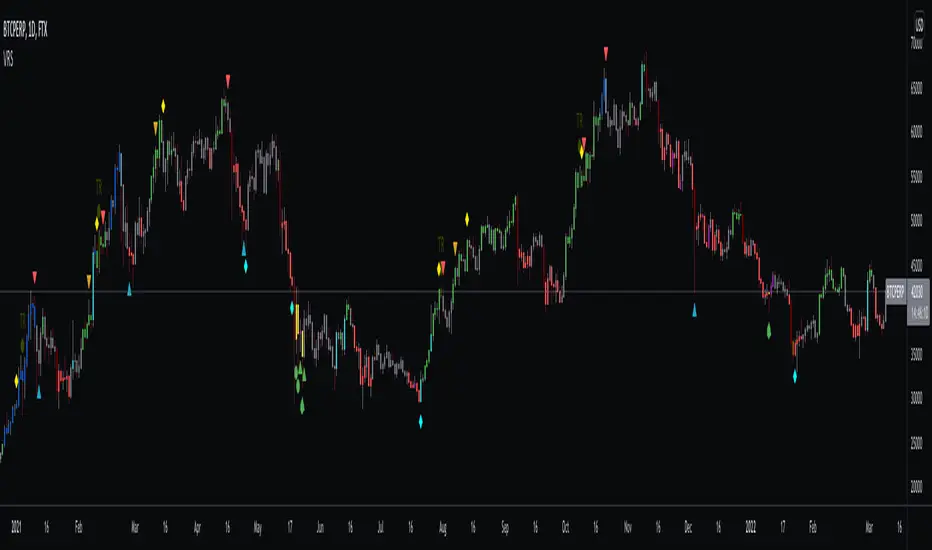
After feedback from users I decided to switch up the Buy/Sell symbols to make the meaning more obvious. In short:
All symbols above the candles are Sell/Short signals
All symbols below the candles are Buy/Long signals
From my experience and testing:
Green and Red "L/S"s are work best on lower timeframes (15min-2h) but work also on higher timeframes
esp. when prices dump or pump very hard.
Blue and Orange "L/S"s are meant to be used on higher trimeframes, the alogrithm uses mostly filtered moving averages and on current settings
it's designed for timeframes 4h or more.
The small red and green triangles work on all timeframes but are more meant to be "take profit" points rather than entries. If other technical analysis
suggests a good entry, you can use these as a secondary method for more confidence.
The purble "L" is a special buy/long signal designed to catch deep wicks/dumps to get confidence when to buy into a dip.
版本注释
* Added new Alert Conditions to all signals and bar colors. * Minor improvements to signal conditions.
版本注释
Added alert conditions for volume pump / dump candles per user request.版本注释
Small change before a bigger overhaul.* Changed the style of the signals to a more sleek look
* Removed the purple Long because it was just to unreliable imo
版本注释
* Optimized parameters to improve accuracy of signals* Changed visuals because of mobile issues
* Removed "Special signal" because of inaccuracy
版本注释
* Just updated the picture 仅限邀请脚本
只有作者授权的用户才能访问此脚本。您需要申请并获得使用许可。通常情况下,付款后即可获得许可。更多详情,请按照下方作者的说明操作,或直接联系ru0ka。
TradingView不建议您付费购买或使用任何脚本,除非您完全信任其作者并了解其工作原理。您也可以在我们的社区脚本找到免费的开源替代方案。
作者的说明
To get access to this indicator please write me a private message here or on twitter @vincentruoka or visit:
https://www.patreon.com/vincentruoka
免责声明
这些信息和出版物并非旨在提供,也不构成TradingView提供或认可的任何形式的财务、投资、交易或其他类型的建议或推荐。请阅读使用条款了解更多信息。
仅限邀请脚本
只有作者授权的用户才能访问此脚本。您需要申请并获得使用许可。通常情况下,付款后即可获得许可。更多详情,请按照下方作者的说明操作,或直接联系ru0ka。
TradingView不建议您付费购买或使用任何脚本,除非您完全信任其作者并了解其工作原理。您也可以在我们的社区脚本找到免费的开源替代方案。
作者的说明
To get access to this indicator please write me a private message here or on twitter @vincentruoka or visit:
https://www.patreon.com/vincentruoka
免责声明
这些信息和出版物并非旨在提供,也不构成TradingView提供或认可的任何形式的财务、投资、交易或其他类型的建议或推荐。请阅读使用条款了解更多信息。