PROTECTED SOURCE SCRIPT
已更新 TF
TF is an algorithm that solves one of the big unknowns of any trader, the direction where the prices of the asset will go.
TF is based on the analysis of sentiment and other macro economic factors that influence the evolution of present and future prices of almost any asset.
The algorithm performs the necessary calculations and draws a a lower indicator of green or red bar. In this way alerts a future evolution of prices. As soon as that bar goes from green to red or vice versa, it indicates that prices are going to fall or rise respectively and as long as the indicator bar continues in the same color it indicates that the trend is still strong. This is a dynamic indicator and can change the alert regardless of whether the candle has closed or not.
TF must be used in conjunction with other indicators of your preference to find the right time to go long or short, or to find levels of overbought or oversold, support or resistance levels, Fibonacci or those of your preference to find the best points of entry or exit. In short TF allows to resolve the doubt in which side of the trade I must place, whether to go long or short.
It can be used in any type of asset, Stock, Futures, Forex or Crypto and in almost any time frame. The greater the volatility of the asset, the timeframe may be shorter.
AAPL 2018 in a daily basis highlighting the buying days

AAPL 2018 in a daily basis highlighting the selling days

ESZ8 in 15 min time frame

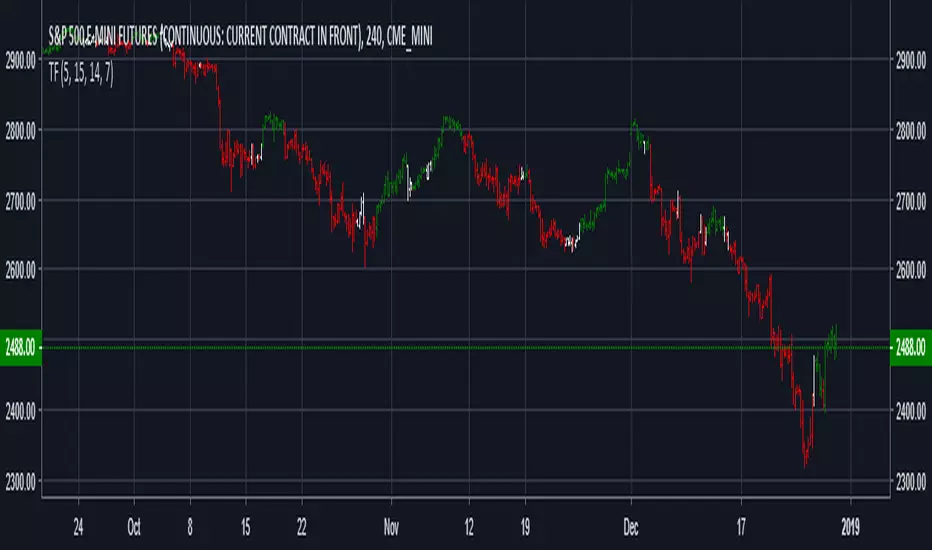
CLF9 in 240 min time frame

TF is based on the analysis of sentiment and other macro economic factors that influence the evolution of present and future prices of almost any asset.
The algorithm performs the necessary calculations and draws a a lower indicator of green or red bar. In this way alerts a future evolution of prices. As soon as that bar goes from green to red or vice versa, it indicates that prices are going to fall or rise respectively and as long as the indicator bar continues in the same color it indicates that the trend is still strong. This is a dynamic indicator and can change the alert regardless of whether the candle has closed or not.
TF must be used in conjunction with other indicators of your preference to find the right time to go long or short, or to find levels of overbought or oversold, support or resistance levels, Fibonacci or those of your preference to find the best points of entry or exit. In short TF allows to resolve the doubt in which side of the trade I must place, whether to go long or short.
It can be used in any type of asset, Stock, Futures, Forex or Crypto and in almost any time frame. The greater the volatility of the asset, the timeframe may be shorter.
AAPL 2018 in a daily basis highlighting the buying days
AAPL 2018 in a daily basis highlighting the selling days
ESZ8 in 15 min time frame
CLF9 in 240 min time frame
版本注释
The new version cleans the screen, so now the signals are given in the bar of the chart.As you see a bar change from RED or WHITE to GREEN is time to go LONG. Bar change from GREEN or WHITE to RED is time to go SHORT
As long as the bar stay in the same color GREEN (look to entry for a LONG trade) or RED ( (look to entry for a SHORT trade)
版本注释
minor improvements版本注释
minor improvements受保护脚本
此脚本以闭源形式发布。 但是,您可以自由使用,没有任何限制 — 了解更多信息这里。
免责声明
这些信息和出版物并非旨在提供,也不构成TradingView提供或认可的任何形式的财务、投资、交易或其他类型的建议或推荐。请阅读使用条款了解更多信息。
免责声明
这些信息和出版物并非旨在提供,也不构成TradingView提供或认可的任何形式的财务、投资、交易或其他类型的建议或推荐。请阅读使用条款了解更多信息。