INVITE-ONLY SCRIPT
BKN High Timeframe Levels

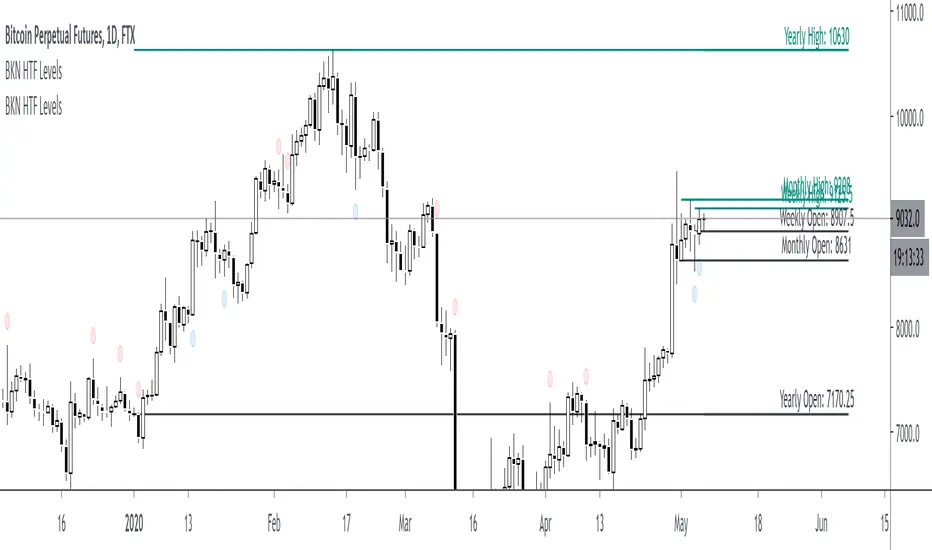
This indicator is developed to mark out yearly, monthly, weekly and daily levels. Allows you to select if you want to plot the open, high or low. Don't really recommend using the indicator for closes as it looks ahead to the current bar so it will just show the current price as the close.
High timeframe opens specifically are great levels to watch for reactions. By request, we've added the ability to plot highs or lows in addition to the opens. If you'd like to see opens as well as highs or lows, you would add the indicator to your chart twice and you have the option to change the color of the lines on the secondary indicator.
High timeframe opens specifically are great levels to watch for reactions. By request, we've added the ability to plot highs or lows in addition to the opens. If you'd like to see opens as well as highs or lows, you would add the indicator to your chart twice and you have the option to change the color of the lines on the secondary indicator.
免责声明
这些信息和出版物并非旨在提供,也不构成TradingView提供或认可的任何形式的财务、投资、交易或其他类型的建议或推荐。请阅读使用条款了解更多信息。