OPEN-SOURCE SCRIPT
已更新 Follow Trend - Wall Street Strategy
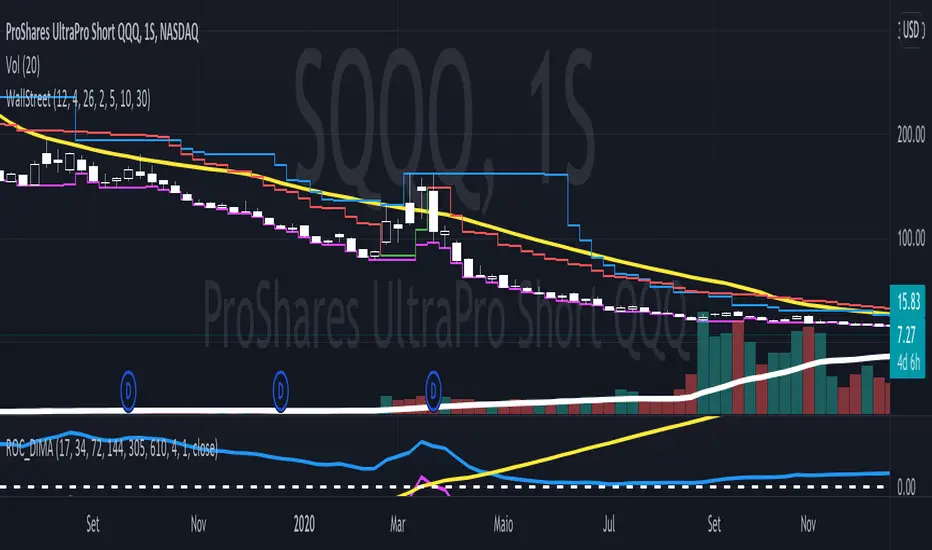
It is a mix of three common indicators, they are The High band level of Donchian Channel, 6 emas (17, 34, 72, 144, 200 and 305), and 2 VStop with different multipliers.
We search stocks are going higher and higher each time. So we look at the High-level Donchian band and if the price made a little correction and didn't touch the VStop indicator and, the price is higher than all the ema's. So we try to buy the stocks when it pass through the last highest price.
The Vstop-short we use to stocks and commodities.
The VStop-long, we use to Bonds and Reits.
In order to help, there is a triangle when the price crossover any VStop, at least the half of Donchian period.
版本注释
I forgot one of the ema's版本注释
There are some other possibilities about crossing price and VStop-short and VStop-long that I was forgot. Now it is complete!版本注释
Some wrong indication on it touch the VStop版本注释
EMA's change color to green when the price is upper than ema's and they are red when the price is lower than they.版本注释
1 -I put the correct name of each ema in plot and now they are the same at the user display2- All the important values are showing at the end . There is a resume of our strategy, Its show the start price (the highest value + 0.01), the short-stop value, the long-stop value and its brings if all the price is higher then all ema's ploted. If one of the ema's is above the price, it will show the ema's problem and don;t shows the our strategy value.
版本注释
Legend text now is white, not black.版本注释
User can choose DarkTheme or LightTheme on the legends版本注释
Now its show the relation risc vs return at each ATR版本注释
In some stocks, we don't have enough data to calculate large ema's, so in these cases, the strategy shows Ema's Bad but it isn't true. we don't have enough data to calculate it. In those cases, we will ignore them. When the close price was below ema our script says it was bad, but it isn't true either. It is irrelevant for our strategy because the price along the week was above the ema, so now we calculate the ema using the high price along the week.
版本注释
I changed some indicators colors. I added dashed extend lines to show here are the vstop, vstop2 and buyprice.版本注释
DarkTheme is working nowSubtract some indicators that we didn't use anymore.
Now is more simply. They are project to weekly graphcs.
版本注释
Correction on value of Donchian Bottom版本注释
Change Colors on Donchian Bottom and EMA2版本注释
Change Line Styles版本注释
The Vstop line has two color. When the vstop price is less than close price the line will be green and when the vstop price is higher then close price it will be red.开源脚本
秉承TradingView的精神,该脚本的作者将其开源,以便交易者可以查看和验证其功能。向作者致敬!您可以免费使用该脚本,但请记住,重新发布代码须遵守我们的网站规则。
免责声明
这些信息和出版物并非旨在提供,也不构成TradingView提供或认可的任何形式的财务、投资、交易或其他类型的建议或推荐。请阅读使用条款了解更多信息。
免责声明
这些信息和出版物并非旨在提供,也不构成TradingView提供或认可的任何形式的财务、投资、交易或其他类型的建议或推荐。请阅读使用条款了解更多信息。