PROTECTED SOURCE SCRIPT
RSI divergence(mom check)
The core of this indicator is obviously RSI divergence. But there are some tips I would like to explain and suggest.
First of all, although the basic principle of this indicator is simple: simply comparing the price and RSI value within a given time period. To be more specific, if the price now is lowest among last 300 candlesticks but its RSI value is not, then the candlesticks will be marked. However, sometimes it is not accurate. Here are some examples:

This is bitcoin 2h chart from COINBASE. It is true that we can capture most of corrections and make a fortune during a bull market. However, the market is not always consist of bull market:

This is also bitcoin 2h chart from COINBASE. We can imagine how much money we would lose if we buy every time solely according to the RSI divergence signals during a bear market. So, how to solve this question? As a bullish indicator, it's normal to have distortions in a bear market, but I still hope to improve its win rate and make it more reliable even though when people are trading during a bear market. So we need to add some filtering conditions to screen out all the divergence signals.
The first indicator came in my mind is: Momentum. Here is the momentum code with its zero axis:
Pine Script®
One thing we should notice is that ’30’ is the time period of the momentum, you can change this to everything you want according to which assets you are trading. For example, in a long-run bullish stock market or gold market, you can set ’60’. But when it comes to futures or crypto, maybe 30 is a better choice.
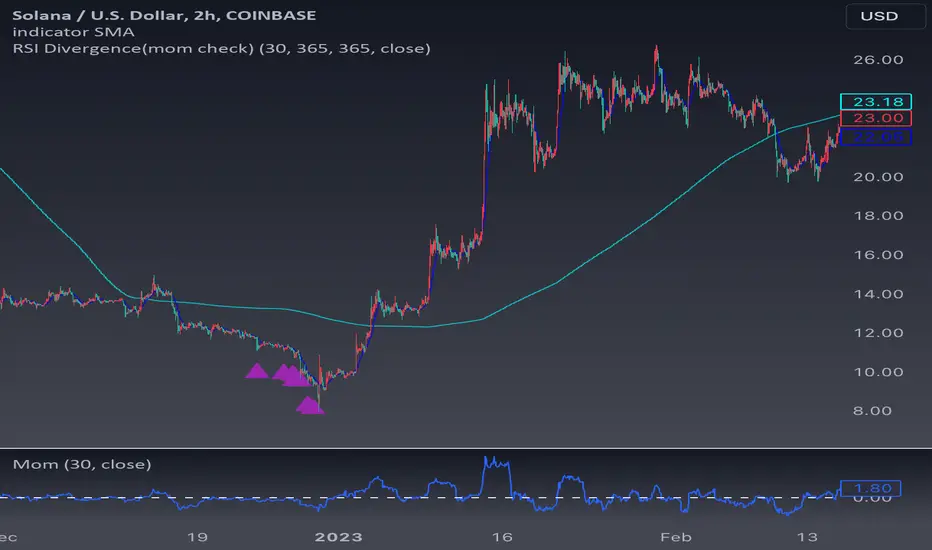
Now, I use momentum as a condition to distinguish a bearish trend: if the all momentum value of past 100 candlesticks of my RSI divergence signals are minus, which means these divergence signals are in a bearish trend, in this case, I market them as purple signal2. Attached are some examples of BTC, ETH and SOL charts. We can see if we trade according to green signal1s. We gonna have to cut our losses multiple times, and for leveraged traders, it could even mean facing liquidation. However, signal2 has helped filter most of signal1s. So in most conditions, I believe the appearance of signal2 represents the end of bearish trends.


So far, we have created an overall frame. And I have set ‘alertcondition’ functions so that we can use this indicator to set alerts.
Here are some tips I would like to suggest based on my personal experiences:
1. Set stop losses and follow them strictly;
2. Adjust the time period according to different assets. For instance, 4h chart is good for bitcoin and most altcoin. But when it comes to stock market, 12h or 1d may be a better choice. You need to find the best suitable time period by yourself;
3. In a bear market, please be especially cautious with the green Signal 1; they are great for following uptrends but are not suitable for bottom-fishing. I recommend waiting for the purple Signal 2 to appear before placing trust again in the green Signal 1.
4. To be continued….
First of all, although the basic principle of this indicator is simple: simply comparing the price and RSI value within a given time period. To be more specific, if the price now is lowest among last 300 candlesticks but its RSI value is not, then the candlesticks will be marked. However, sometimes it is not accurate. Here are some examples:
This is bitcoin 2h chart from COINBASE. It is true that we can capture most of corrections and make a fortune during a bull market. However, the market is not always consist of bull market:
This is also bitcoin 2h chart from COINBASE. We can imagine how much money we would lose if we buy every time solely according to the RSI divergence signals during a bear market. So, how to solve this question? As a bullish indicator, it's normal to have distortions in a bear market, but I still hope to improve its win rate and make it more reliable even though when people are trading during a bear market. So we need to add some filtering conditions to screen out all the divergence signals.
The first indicator came in my mind is: Momentum. Here is the momentum code with its zero axis:
//@version=5
indicator(title="Momentum", shorttitle="Mom", timeframe="", timeframe_gaps=true)
//input variables
len = input.int(30, minval=1, title="Length")
src = input(close, title="Source")
//calculate momentum
mom = src - src[len]
//draw momentum chart
plot(mom, color=#2962FF, title="MOM")
//draw 0 axis
hline(0, "Zero Line", color=color.white)
One thing we should notice is that ’30’ is the time period of the momentum, you can change this to everything you want according to which assets you are trading. For example, in a long-run bullish stock market or gold market, you can set ’60’. But when it comes to futures or crypto, maybe 30 is a better choice.
Now, I use momentum as a condition to distinguish a bearish trend: if the all momentum value of past 100 candlesticks of my RSI divergence signals are minus, which means these divergence signals are in a bearish trend, in this case, I market them as purple signal2. Attached are some examples of BTC, ETH and SOL charts. We can see if we trade according to green signal1s. We gonna have to cut our losses multiple times, and for leveraged traders, it could even mean facing liquidation. However, signal2 has helped filter most of signal1s. So in most conditions, I believe the appearance of signal2 represents the end of bearish trends.
So far, we have created an overall frame. And I have set ‘alertcondition’ functions so that we can use this indicator to set alerts.
Here are some tips I would like to suggest based on my personal experiences:
1. Set stop losses and follow them strictly;
2. Adjust the time period according to different assets. For instance, 4h chart is good for bitcoin and most altcoin. But when it comes to stock market, 12h or 1d may be a better choice. You need to find the best suitable time period by yourself;
3. In a bear market, please be especially cautious with the green Signal 1; they are great for following uptrends but are not suitable for bottom-fishing. I recommend waiting for the purple Signal 2 to appear before placing trust again in the green Signal 1.
4. To be continued….
受保护脚本
此脚本以闭源形式发布。 但是,您可以自由使用,没有任何限制 — 了解更多信息这里。
免责声明
这些信息和出版物并非旨在提供,也不构成TradingView提供或认可的任何形式的财务、投资、交易或其他类型的建议或推荐。请阅读使用条款了解更多信息。
免责声明
这些信息和出版物并非旨在提供,也不构成TradingView提供或认可的任何形式的财务、投资、交易或其他类型的建议或推荐。请阅读使用条款了解更多信息。