OPEN-SOURCE SCRIPT
RSI Strategy with Adjustable RSI and Stop-Loss
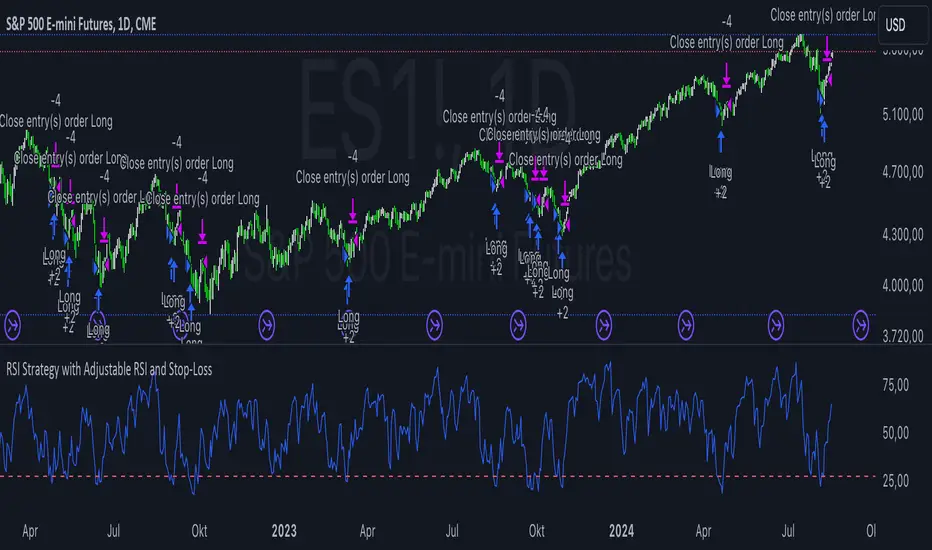
This trading strategy uses the Relative Strength Index (RSI) and a Stop-Loss mechanism to make trading decisions. Here’s a breakdown of how it works:
RSI Calculation:
The RSI is calculated based on the user-defined length (rsi_length). This is a momentum oscillator that measures the speed and change of price movements.
Buy Condition:
The strategy generates a buy signal when the RSI value is below a user-defined threshold (rsi_threshold). This condition indicates that the asset might be oversold and potentially due for a rebound.
Stop-Loss Mechanism:
Upon triggering a buy signal, the strategy calculates the Stop-Loss level. The Stop-Loss level is set to a percentage below the entry price, as specified by the user (stop_loss_percent). This level is used to limit potential losses if the price moves against the trade.
Sell Condition:
A sell signal is generated when the current closing price is higher than the highest high of the previous day. This condition suggests that the price has reached a new high, and the strategy decides to exit the trade.
Plotting:
The RSI values are plotted on the chart for visual reference. A horizontal line is drawn at the RSI threshold level to help visualize the oversold condition.
Summary
Buying Strategy: When RSI is below the specified threshold, indicating potential oversold conditions.
Stop-Loss: Set based on a percentage of the entry price to limit potential losses.
Selling Strategy: When the price surpasses the highest high of the previous day, signaling a potential exit point.
This strategy aims to capture potential rebounds from oversold conditions and manage risk using a Stop-Loss mechanism. As with any trading strategy, it’s essential to test and optimize it under various market conditions to ensure its effectiveness.
开源脚本
秉承TradingView的精神,该脚本的作者将其开源,以便交易者可以查看和验证其功能。向作者致敬!您可以免费使用该脚本,但请记住,重新发布代码须遵守我们的网站规则。
Where others speculate, we systematize.
edgetools.org
edgetools.org
免责声明
这些信息和出版物并非旨在提供,也不构成TradingView提供或认可的任何形式的财务、投资、交易或其他类型的建议或推荐。请阅读使用条款了解更多信息。
开源脚本
秉承TradingView的精神,该脚本的作者将其开源,以便交易者可以查看和验证其功能。向作者致敬!您可以免费使用该脚本,但请记住,重新发布代码须遵守我们的网站规则。
Where others speculate, we systematize.
edgetools.org
edgetools.org
免责声明
这些信息和出版物并非旨在提供,也不构成TradingView提供或认可的任何形式的财务、投资、交易或其他类型的建议或推荐。请阅读使用条款了解更多信息。