PROTECTED SOURCE SCRIPT
已更新 NAMA Cloud - Quan Dao

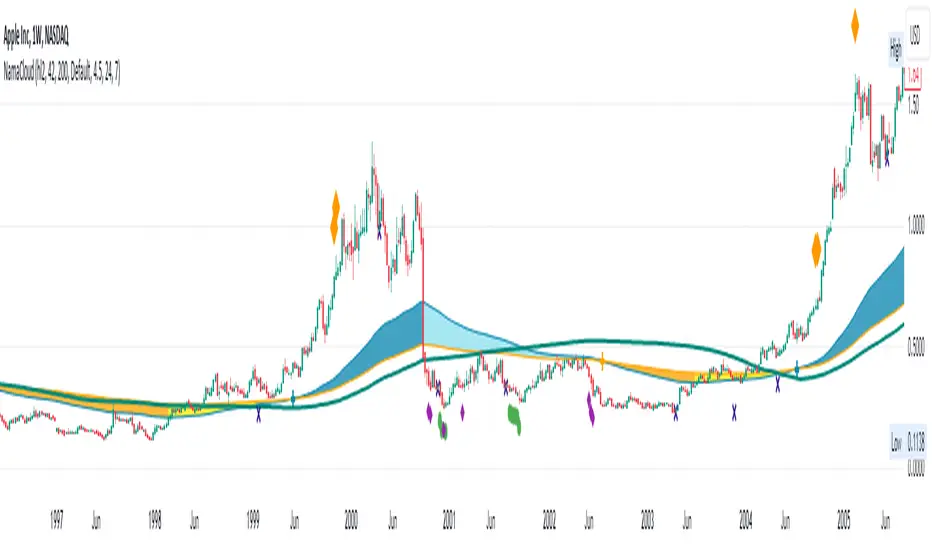
Application of Non-Adaptive Moving Average (NAMA) by using a fast and slow MAs to draw a trending cloud.
Using this indicator, one might have an overview look on the trend of the security now.
- These 2 MAs are NOT dependant on the starting length (thus user does not have to choose the length of the MAs anymore).
- When the fast MA is above the slow MA, most likely the trend is up (blue color).
- When the fast MA is below the slow MA, most likely it's an down trend (orange color).
- When the two MAs cross, most likely there will be a trend change (small or big) soon.
You can also show/hide a bands (ATR, Bollingers, ...) in this indicator as well.
版本注释
Enable to show the buy and sell signals by default.Once signaled it does not mean that you should enter the trade immediately.
It just simply informed that it's time to take some actions. You should use these signals in conjunction with signals from other indicators as well.
- Orange diamond above the candle: 5 green candles in a row, can sell to take profit.
- Purple diamond below the candle: 3 red candles in a row in a weak uptrend, can consider to buy as a pullback.
- Green circle below the candle: low point in a downtrend, can consider to buy as a reversal is likely to come.
受保护脚本
此脚本以闭源形式发布。 但是,您可以自由使用,没有任何限制 — 了解更多信息这里。
免责声明
这些信息和出版物并非旨在提供,也不构成TradingView提供或认可的任何形式的财务、投资、交易或其他类型的建议或推荐。请阅读使用条款了解更多信息。
受保护脚本
此脚本以闭源形式发布。 但是,您可以自由使用,没有任何限制 — 了解更多信息这里。
免责声明
这些信息和出版物并非旨在提供,也不构成TradingView提供或认可的任何形式的财务、投资、交易或其他类型的建议或推荐。请阅读使用条款了解更多信息。