OPEN-SOURCE SCRIPT
Price Movement Trend By Alireza Phoenix (Logarithmic)
hi Traders
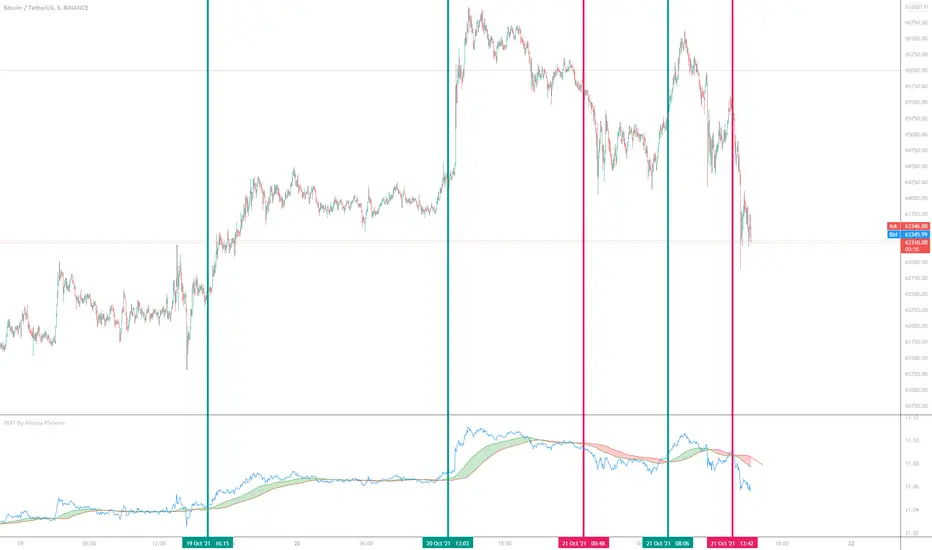
This logarithmic indicator shows the price movement trend, which is designed based on logarithmic functions and moving averages.
The Price Movement Trend Display Composed By :
A leading line consisting of the natural logarithm of Running Moving Average with length 60 and Offset 20 , and is displayed in red line.
A signal line consisting of a natural logarithm of an exponential moving average of length 90 , and is displayed in green line.
A price line consisting of the natural logarithm of a simple moving average along 1 whose source is price close , and is displayed in blue line.
A hidden price line consisting of the natural logarithm of a simple moving average along 1 and its source being the highest and lowest average prices , and is displayed in maroon line.
Learning how to get a signal from the price Movement trend indicator:
Moving the signal line and breaking the leading line upwards to form a green cloud is a buy signal.
Moving the signal line and breaking the leading line downwards that forms a red cloud is a sell signal.
Moving the price line and breaking the trend cloud upward , is a buy signal
Moving the price line and breaking the trend cloud downwards , is a sell signal
My instagram id : @pnxf6
ترجمه فارسی :
سلام تریدرها
این اندیکاتور لگاریتمی ، نمایش دهنده روند حرکتی قیمت است ، که بر اساس توابع لگاریتمی و میانگین های متحرک قیمت طراحی شده است
این اندیکاتور تشکیل شده از :
یک خط پیشرو متشکل از لگاریتم طبیعی متحرک وزنی نمایی مورد استفاده درآر اس آی به طول 60 و انحراف 20 است
یک خط سیگنال متشکل از لگاریتم طبیعی میانگین متحرک نمایی با طول 90
یک خط قیمت که متشکل از لگاریتم طبیعی میانگین متحرک ساده در طول 1 که منبع آن بسته شدن قیمت است.
یک خط قیمت مخفی که متشکل از لگاریتم طبیعی میانگین متحرک ساده در طول 1 و منبع آن میانگین بالاترین و پایین ترین قیمت است
یک فضای ابری مابین خط پیشرو و خط سیگنال که که با "نمایش روند حرکت قیمت" مشخص شده و در رنگ های سبز و قرمز قابل مشاهده میباشد.
آموزش گرفتن سیگنال ازاندیکاتور نمایش روند قیمت :
حرکت خط سیگنال و شکستن خط پیشرو رو به بالا که تشکیل ابر سبز رنگ میدهد یک سیگنال خرید میباشد .
حرکت خط سیگنال و شکستن خط پیشرو رو به پایین که تشکیل ابر قرمز رنگ میدهد یک سیگنال فروش میباشد .
حرکت خط قیمت و شکستن ابر روند حرکت قیمت رو به بالا سیگنال خرید میباشد
حرکت خط قیمت و شکستن ابر روند حرکت قیمت رو به پایین سیگنال فروش میباشد.
开源脚本
秉承TradingView的精神,该脚本的作者将其开源,以便交易者可以查看和验证其功能。向作者致敬!您可以免费使用该脚本,但请记住,重新发布代码须遵守我们的网站规则。
免责声明
这些信息和出版物并非旨在提供,也不构成TradingView提供或认可的任何形式的财务、投资、交易或其他类型的建议或推荐。请阅读使用条款了解更多信息。
开源脚本
秉承TradingView的精神,该脚本的作者将其开源,以便交易者可以查看和验证其功能。向作者致敬!您可以免费使用该脚本,但请记住,重新发布代码须遵守我们的网站规则。
免责声明
这些信息和出版物并非旨在提供,也不构成TradingView提供或认可的任何形式的财务、投资、交易或其他类型的建议或推荐。请阅读使用条款了解更多信息。