OPEN-SOURCE SCRIPT
Hancock - WAE
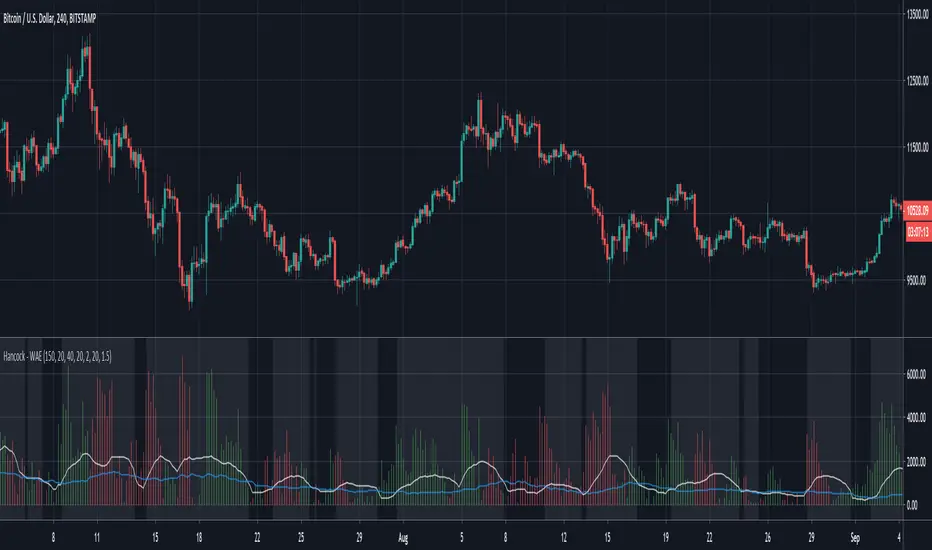
This is a version of the LazyBear Waddah Attar Explosion indicator that incorporates the LazyBear Squeeze Momentum Indicator. Full credit goes to LazyBear for this and i've added links to his indicators used for a further explanation.
This histogram is a plot of the difference between the current and previous MACD multiplier by the sensitivity value. Green indicates an up trend and red indicates a down trend.
The white line is the lower BB subtracted from the upper BB and signals should be taken when the histogram is greater than this line.
The blue line is taken from the Squeeze Indicator and is the Keltner Channel. If the white line is less than the blue line it can be considered a squeeze and the background color of the indicator is coloured to indicate when not in a squeeze.
Happy trading folks!
Hancock
开源脚本
秉承TradingView的精神,该脚本的作者将其开源,以便交易者可以查看和验证其功能。向作者致敬!您可以免费使用该脚本,但请记住,重新发布代码须遵守我们的网站规则。
免责声明
这些信息和出版物并非旨在提供,也不构成TradingView提供或认可的任何形式的财务、投资、交易或其他类型的建议或推荐。请阅读使用条款了解更多信息。
免责声明
这些信息和出版物并非旨在提供,也不构成TradingView提供或认可的任何形式的财务、投资、交易或其他类型的建议或推荐。请阅读使用条款了解更多信息。