OPEN-SOURCE SCRIPT
MCDX_Signal
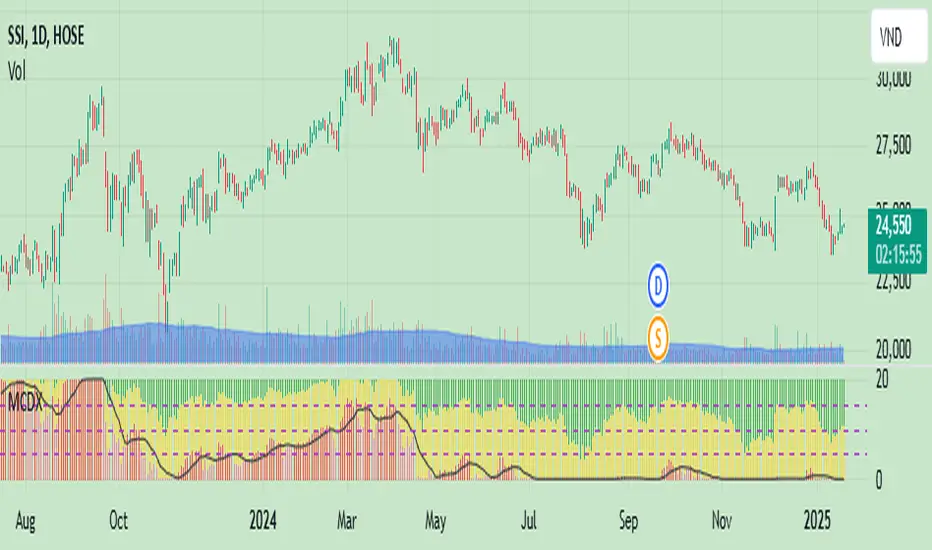
The MCDX indicator (Market Cycle Dynamic Index) is a technical indicator developed by Trung Pham. It is a tool used for analyzing the stock market, often utilized to identify big money flow (Big Money) and evaluate the strength of individual stocks or the overall market.
MCDX is known for its distinctive histogram chart with red and green bars. The red bars typically represent the inflow of big money, while the green bars indicate small money flow or outflows.
MCDX is known for its distinctive histogram chart with red and green bars. The red bars typically represent the inflow of big money, while the green bars indicate small money flow or outflows.
开源脚本
秉承TradingView的精神,该脚本的作者将其开源,以便交易者可以查看和验证其功能。向作者致敬!您可以免费使用该脚本,但请记住,重新发布代码须遵守我们的网站规则。
免责声明
这些信息和出版物并非旨在提供,也不构成TradingView提供或认可的任何形式的财务、投资、交易或其他类型的建议或推荐。请阅读使用条款了解更多信息。
开源脚本
秉承TradingView的精神,该脚本的作者将其开源,以便交易者可以查看和验证其功能。向作者致敬!您可以免费使用该脚本,但请记住,重新发布代码须遵守我们的网站规则。
免责声明
这些信息和出版物并非旨在提供,也不构成TradingView提供或认可的任何形式的财务、投资、交易或其他类型的建议或推荐。请阅读使用条款了解更多信息。