OPEN-SOURCE SCRIPT
已更新 Bond Yeild Curve
Bond Yeild Curve
A bond yeild curve is a line that plot the interest rate of bonds of each maturity dates.
The slope of the curve give the future of economy cycle.
if the slope could be normal (positive), flat or even inverted.
This indicator aquired data of bond yeild provided by TradingView.
How to use it.
How we can get the benefit.
- If the current spread is greater than 1.0, it suppose that the economy of that country probably is ok.
- if the current spread is between 0 - 1.0, it suppose to be flatted and probably turn to invert and the economy cound be in a recession soon.
- if the current spread is below 0, it suppose to be inverted and economy is in recession.
when knowing the state of economy, it would help us to manage our investment.
When you select "Yeild"

When you select "Spread"

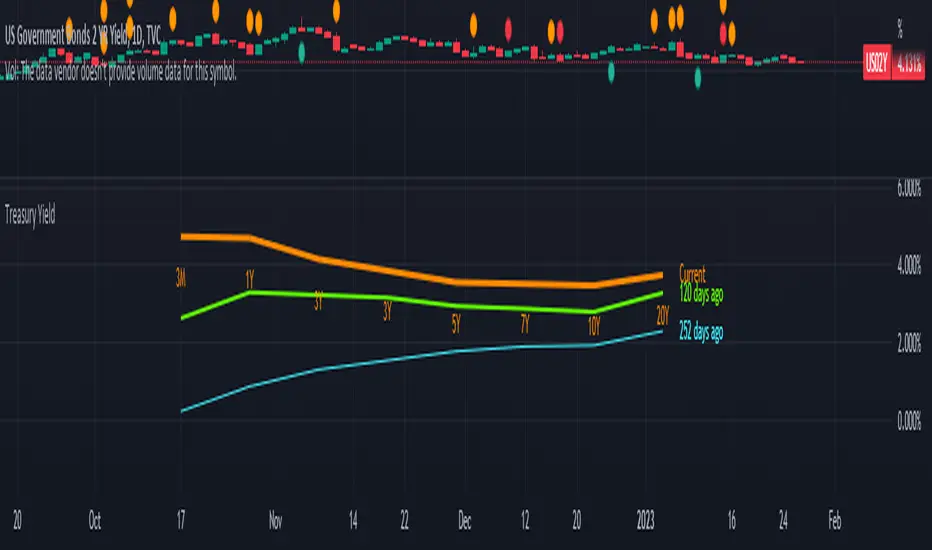
When you select "Yeild Curve"

I'm new for this.
if any idea, correction and suggestion, i do appreciate it.
A bond yeild curve is a line that plot the interest rate of bonds of each maturity dates.
The slope of the curve give the future of economy cycle.
if the slope could be normal (positive), flat or even inverted.
This indicator aquired data of bond yeild provided by TradingView.
How to use it.
- Select the country of the bond / another country to compare.
- Select the maturity of bond (this indicator set 2Y, 5Y, 10Y and 20Y as default).
- You can toggle to 3 different data set; Yeild, Spread (10Y-2Y) and Yeild Curve.
- In case that you select the "Yeild Curve", you can customize the desired past period to compare.
How we can get the benefit.
- If the current spread is greater than 1.0, it suppose that the economy of that country probably is ok.
- if the current spread is between 0 - 1.0, it suppose to be flatted and probably turn to invert and the economy cound be in a recession soon.
- if the current spread is below 0, it suppose to be inverted and economy is in recession.
when knowing the state of economy, it would help us to manage our investment.
When you select "Yeild"
When you select "Spread"
When you select "Yeild Curve"
I'm new for this.
if any idea, correction and suggestion, i do appreciate it.
版本注释
Update. 1) Compare yield curve over period of time of treasury yield.
2) Compare yield curve between countries.
3) Show yield of each ttm in line chart.
Available TTM : 3M, 1Y, 2Y, 3Y, 5Y, 7Y, 10Y, 20Y
Some code i refer to this guy.
BarefootJoey :

版本注释
Minor fixed.版本注释
Update code and added 2-10 Spread. 开源脚本
秉承TradingView的精神,该脚本的作者将其开源,以便交易者可以查看和验证其功能。向作者致敬!您可以免费使用该脚本,但请记住,重新发布代码须遵守我们的网站规则。
免责声明
这些信息和出版物并非旨在提供,也不构成TradingView提供或认可的任何形式的财务、投资、交易或其他类型的建议或推荐。请阅读使用条款了解更多信息。
免责声明
这些信息和出版物并非旨在提供,也不构成TradingView提供或认可的任何形式的财务、投资、交易或其他类型的建议或推荐。请阅读使用条款了解更多信息。