OPEN-SOURCE SCRIPT
已更新 VIX Oscillator
OVERVIEW
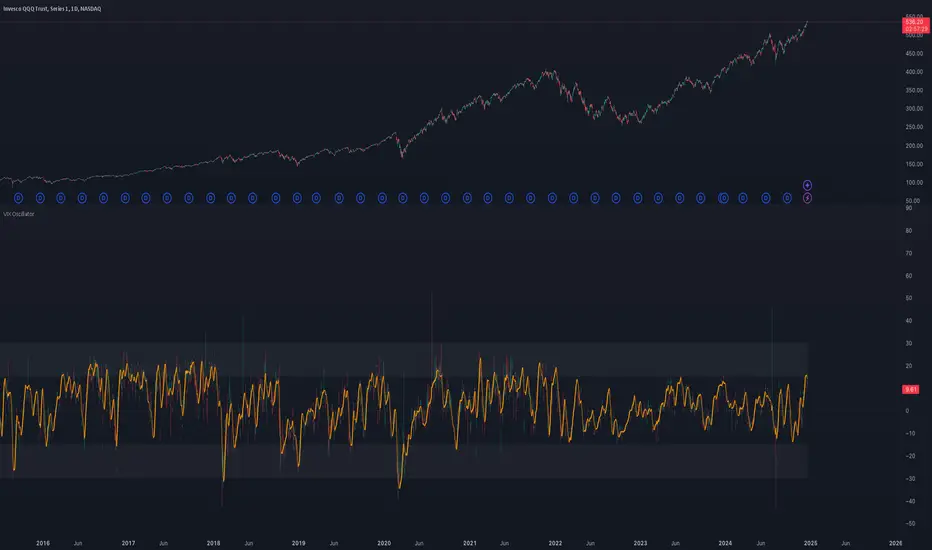
Plots an oscillating value as a percentage, derived from the VIX and VIX3M. This can help identify broader market trends and pivots on higher time frames (ie. 1D), useful when making swing trades.
DATA & MATH
The VIX is a real-time index of expected S&P 500 volatility over the next 30 days, derived from option prices with near-term expirations. Similarly, the VIX3M measures expected volatility over the next 90 days.
Dividing one by the other yields an oscillating value, normalizing the relative strength of the expected volatility. Most commonly the VIX is divided by the VIX3M. However, because the VIX is inversely correlated to market sentiment (typically), this indicator divides the VIX3M by the VIX to visually correlate the plot direction with the anticipated market direction. Further, it subtracts 1.1 from the quotient to visually center the plot, and multiplies that difference by 100 to amplify the value as a percentage:
( VIX3M / VIX - 1.1 ) * 100
This variation makes identifying sentiment extremes easier within a buy-low-sell-high paradigm, where values below zero are bearish and values above zero are bullish.
PLOTS
Two plots are used, maximizing data fidelity and convenience. Candles are used to accurately reflect the quantized math and a Linear Regression is used to simplify contextualization. If you're not familiar with what a Linear Regression is, you can think of it like a better moving average. High / Low zones are also plotted to help identify sentiment extremes.
This combination allows you to quickly identify the expected sentiment (bullish / bearish) and its relative value (normal / extreme), which you can then use to anticipate if a trend continuation or pivot is more likely.
INPUTS
Candle colors (rise and fall)
Linear regression colors and length
Zone thresholds and zero line
版本注释
- Added indicator page link to the top of the source code.
版本注释
- Improved logic to more gracefully handle null values on lower timeframes
- Other minor enhancements
版本注释
- Added ability to explicitly disable / enable plot inversion.
- Other minor code enhancements.
版本注释
- Modified request.security() to included barmerge.lookahead_on, allowing the plot to update in realtime (rather than being delayed by 1 bar).
开源脚本
秉承TradingView的精神,该脚本的作者将其开源,以便交易者可以查看和验证其功能。向作者致敬!您可以免费使用该脚本,但请记住,重新发布代码须遵守我们的网站规则。
Discord: discord.gg/bPAPhwUeud
Website: liquid-trader.com
Website: liquid-trader.com
免责声明
这些信息和出版物并非旨在提供,也不构成TradingView提供或认可的任何形式的财务、投资、交易或其他类型的建议或推荐。请阅读使用条款了解更多信息。
开源脚本
秉承TradingView的精神,该脚本的作者将其开源,以便交易者可以查看和验证其功能。向作者致敬!您可以免费使用该脚本,但请记住,重新发布代码须遵守我们的网站规则。
Discord: discord.gg/bPAPhwUeud
Website: liquid-trader.com
Website: liquid-trader.com
免责声明
这些信息和出版物并非旨在提供,也不构成TradingView提供或认可的任何形式的财务、投资、交易或其他类型的建议或推荐。请阅读使用条款了解更多信息。