OPEN-SOURCE SCRIPT
已更新 Pickledeggtradermans RSI MA
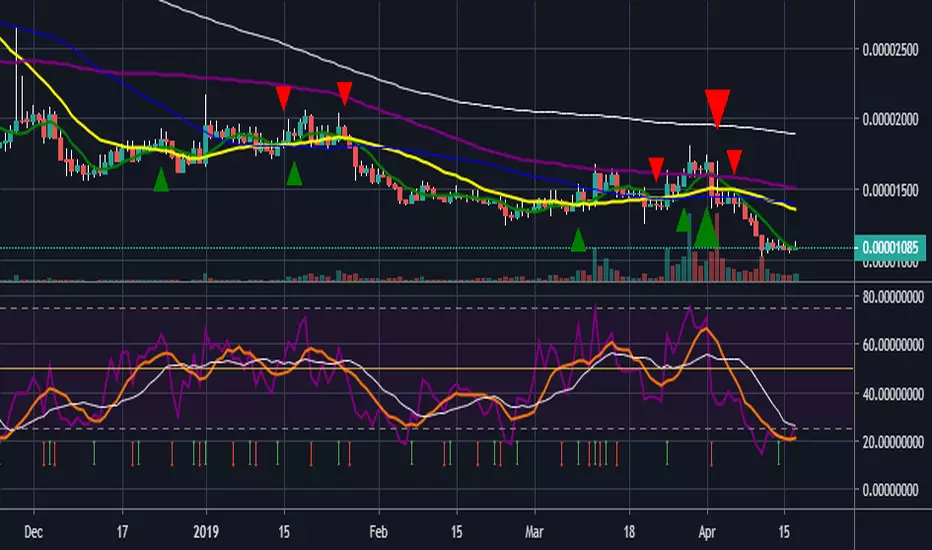
Hey guys just published another script that allows you to plot 3 sma's onto the RSI chart. Firstly the RSI close input is set to 7. the first sma is set at one in purple which is the current RSI level. Second MA is set at 7 and in orange, third and fourth ma's set to 14 and 21 in white and green respectively. Overbought/Oversold levels set at 75/25 with a midline at 50. These can all be tweaked to your liking. Enjoy
版本注释
added an arrow indicator that shows when the rsi 7ma crosses over the rsi 1ma. Although this seems to slightly lag the cross i will be working to update the script to publish the arrows as soon as the cross happens when i get a little time to figure it out. Enjoy开源脚本
秉承TradingView的精神,该脚本的作者将其开源,以便交易者可以查看和验证其功能。向作者致敬!您可以免费使用该脚本,但请记住,重新发布代码须遵守我们的网站规则。
免责声明
这些信息和出版物并非旨在提供,也不构成TradingView提供或认可的任何形式的财务、投资、交易或其他类型的建议或推荐。请阅读使用条款了解更多信息。
开源脚本
秉承TradingView的精神,该脚本的作者将其开源,以便交易者可以查看和验证其功能。向作者致敬!您可以免费使用该脚本,但请记住,重新发布代码须遵守我们的网站规则。
免责声明
这些信息和出版物并非旨在提供,也不构成TradingView提供或认可的任何形式的财务、投资、交易或其他类型的建议或推荐。请阅读使用条款了解更多信息。