OPEN-SOURCE SCRIPT
Enhanced Market Influence Dashboard
Description
The "Enhanced Market Influence Dashboard" (EMID) is a sophisticated trading indicator developed in Pine Script, designed to provide traders with a comprehensive view of the market's influences by analyzing a diverse set of financial instruments. This script integrates various market data, calculates dynamic weights based on volatility, and combines them into a composite score to help traders identify significant market movements.
Concept and Methodology
The EMID indicator aggregates data from multiple financial instruments, including forex pairs, commodities, indices, and ETFs. By calculating the median and volatility of these instruments over user-defined timelines, it dynamically adjusts their weights to reflect current market conditions. The composite score generated from these weighted values helps traders understand the overall market influence and detect significant movements.
Key Features
Market Data Integration: The script fetches real-time data from various symbols such as USD/JPY, Gold, Dollar Index (DXY), US Treasury Rate, VIX Index, Crude Oil, EUR/USD, Emerging Market Index, QYLD ETF, and Nasdaq 100 Futures.
1. Dynamic Weight Calculation: The script calculates dynamic weights for each instrument based on their volatility relative to their simple moving average. This approach ensures that more volatile instruments have a proportionally higher impact on the composite score.
2. Median and Volatility Analysis: It uses the median value and standard deviation over specified timelines to gauge the central tendency and volatility of each instrument.
3. Composite Score Generation: By normalizing the difference between current prices and their respective medians, and applying dynamic weights, the script generates a composite score that reflects the overall market sentiment.
4. Baseline Calculation: A dynamic baseline is computed as the median of the composite score over the lookback period, providing a reference point for identifying significant deviations.
5. Alerts: The script includes alert conditions to notify traders of significant market movements, either above or below the baseline by a threshold value.
Usage
To use the EMID indicator, follow these steps:
1. Input Configuration: Adjust the input parameters to suit your trading strategy. The key inputs include:
-Median Timeline: The period for calculating the median values.
-Volatility Timeline: The period for calculating volatility.
-Base Weights: Set the base weights for each financial instrument according to their perceived influence on the market.
-Adding the Indicator: Apply the EMID indicator to your chart in TradingView. Ensure that the symbols used in the script are relevant to your trading strategy and available in your TradingView subscription.
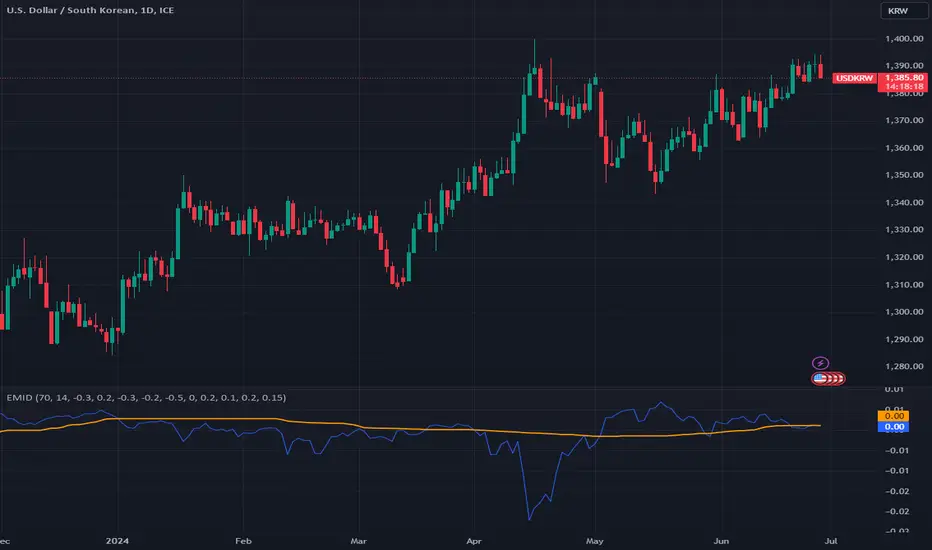
2. Interpreting the Composite Score: The composite score plotted on the chart gives an aggregated view of market influences. Compare the composite score with the baseline to identify significant market movements.
-A composite score significantly above the baseline indicates a potential market uptrend.
-A composite score significantly below the baseline indicates a potential market downtrend.
-Setting Alerts: Use the alert conditions to set up notifications for significant market movements. These alerts help you stay informed about critical changes in market sentiment.
Underlying Calculations
1. Median Calculation: The median function is applied to each instrument's price data over the specified timeline.
2. Volatility Calculation: Volatility is calculated as the standard deviation divided by the simple moving average over the volatility timeline.
3. Dynamic Weight Application: Base weights are multiplied by the respective volatility values to get dynamic weights.
4. Normalized Scores: The script normalizes the difference between current prices and their medians, then multiplies by the dynamic weights to get individual scores.
5. Composite Score: Summing all normalized and weighted scores results in the composite score.
6. Baseline: The baseline is the median of the composite score over the median timeline.
By integrating multiple market influences and dynamically adjusting weights based on volatility, the EMID indicator provides a robust tool for traders to analyze market conditions and make informed trading decisions.
The "Enhanced Market Influence Dashboard" (EMID) is a sophisticated trading indicator developed in Pine Script, designed to provide traders with a comprehensive view of the market's influences by analyzing a diverse set of financial instruments. This script integrates various market data, calculates dynamic weights based on volatility, and combines them into a composite score to help traders identify significant market movements.
Concept and Methodology
The EMID indicator aggregates data from multiple financial instruments, including forex pairs, commodities, indices, and ETFs. By calculating the median and volatility of these instruments over user-defined timelines, it dynamically adjusts their weights to reflect current market conditions. The composite score generated from these weighted values helps traders understand the overall market influence and detect significant movements.
Key Features
Market Data Integration: The script fetches real-time data from various symbols such as USD/JPY, Gold, Dollar Index (DXY), US Treasury Rate, VIX Index, Crude Oil, EUR/USD, Emerging Market Index, QYLD ETF, and Nasdaq 100 Futures.
1. Dynamic Weight Calculation: The script calculates dynamic weights for each instrument based on their volatility relative to their simple moving average. This approach ensures that more volatile instruments have a proportionally higher impact on the composite score.
2. Median and Volatility Analysis: It uses the median value and standard deviation over specified timelines to gauge the central tendency and volatility of each instrument.
3. Composite Score Generation: By normalizing the difference between current prices and their respective medians, and applying dynamic weights, the script generates a composite score that reflects the overall market sentiment.
4. Baseline Calculation: A dynamic baseline is computed as the median of the composite score over the lookback period, providing a reference point for identifying significant deviations.
5. Alerts: The script includes alert conditions to notify traders of significant market movements, either above or below the baseline by a threshold value.
Usage
To use the EMID indicator, follow these steps:
1. Input Configuration: Adjust the input parameters to suit your trading strategy. The key inputs include:
-Median Timeline: The period for calculating the median values.
-Volatility Timeline: The period for calculating volatility.
-Base Weights: Set the base weights for each financial instrument according to their perceived influence on the market.
-Adding the Indicator: Apply the EMID indicator to your chart in TradingView. Ensure that the symbols used in the script are relevant to your trading strategy and available in your TradingView subscription.
2. Interpreting the Composite Score: The composite score plotted on the chart gives an aggregated view of market influences. Compare the composite score with the baseline to identify significant market movements.
-A composite score significantly above the baseline indicates a potential market uptrend.
-A composite score significantly below the baseline indicates a potential market downtrend.
-Setting Alerts: Use the alert conditions to set up notifications for significant market movements. These alerts help you stay informed about critical changes in market sentiment.
Underlying Calculations
1. Median Calculation: The median function is applied to each instrument's price data over the specified timeline.
2. Volatility Calculation: Volatility is calculated as the standard deviation divided by the simple moving average over the volatility timeline.
3. Dynamic Weight Application: Base weights are multiplied by the respective volatility values to get dynamic weights.
4. Normalized Scores: The script normalizes the difference between current prices and their medians, then multiplies by the dynamic weights to get individual scores.
5. Composite Score: Summing all normalized and weighted scores results in the composite score.
6. Baseline: The baseline is the median of the composite score over the median timeline.
By integrating multiple market influences and dynamically adjusting weights based on volatility, the EMID indicator provides a robust tool for traders to analyze market conditions and make informed trading decisions.
开源脚本
秉承TradingView的精神,该脚本的作者将其开源,以便交易者可以查看和验证其功能。向作者致敬!您可以免费使用该脚本,但请记住,重新发布代码须遵守我们的网站规则。
免责声明
这些信息和出版物并非旨在提供,也不构成TradingView提供或认可的任何形式的财务、投资、交易或其他类型的建议或推荐。请阅读使用条款了解更多信息。
免责声明
这些信息和出版物并非旨在提供,也不构成TradingView提供或认可的任何形式的财务、投资、交易或其他类型的建议或推荐。请阅读使用条款了解更多信息。