INVITE-ONLY SCRIPT
已更新 MAPS - HiLo Divergence
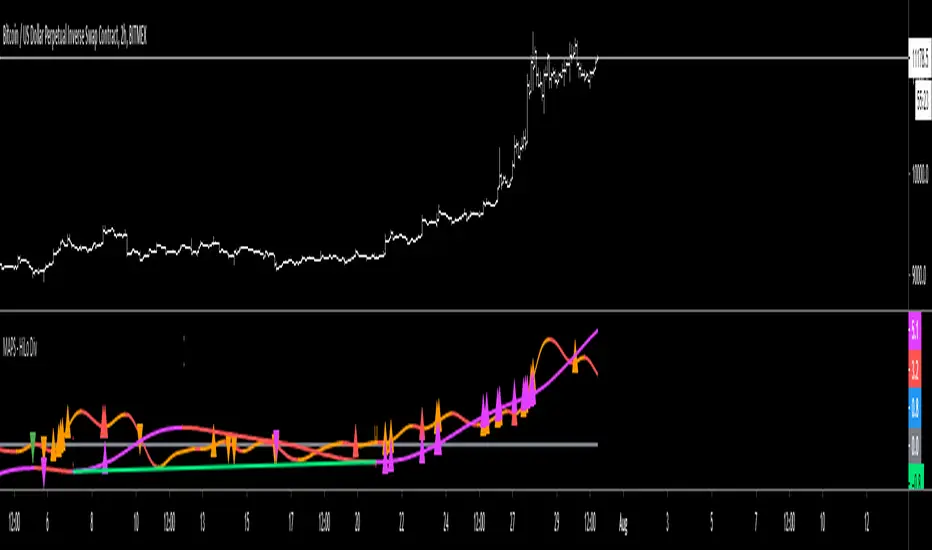
The High/Low indicator utilizes the measuring of local highs and lows as well as local peaks and troughs to identify possible divergence in the price action.
Purple oscillator = Higher Timeframe's price measurement
Purple high triangle = A local high on the higher timeframe has been made
Purple low triangle = A local low on the higher timeframe has been made
Red high triangle on the purple oscillator = A local high on the higher timeframe has been made and is deemed a bearish divergent high
Green low triangle on the purple oscillator = A local low on the higher timeframe has been made and is deemed a bullish divergent low
Orange oscillator = Current Timeframe's price measurement
Orange high triangle = A local high on the current timeframe has been made
Orange low triangle = A local low on the current timeframe has been made
Red high triangle on the orange oscillator = A local high on the current timeframe has been made and is deemed a bearish divergent high
Green low triangle on the orange oscillator = A local low on the current timeframe has been made and is deemed a bullish divergent low
版本注释
Updated colors to show red when oscillators are moving downwards.仅限邀请脚本
只有作者授权的用户才能访问此脚本。您需要申请并获得使用许可。通常情况下,付款后即可获得许可。更多详情,请按照下方作者的说明操作,或直接联系TheTimeCount。
TradingView不建议您付费购买或使用任何脚本,除非您完全信任其作者并了解其工作原理。您也可以在我们的社区脚本找到免费的开源替代方案。
作者的说明
DM me for access to the private indicators twitter.com/TheTimeCount
免责声明
这些信息和出版物并非旨在提供,也不构成TradingView提供或认可的任何形式的财务、投资、交易或其他类型的建议或推荐。请阅读使用条款了解更多信息。
仅限邀请脚本
只有作者授权的用户才能访问此脚本。您需要申请并获得使用许可。通常情况下,付款后即可获得许可。更多详情,请按照下方作者的说明操作,或直接联系TheTimeCount。
TradingView不建议您付费购买或使用任何脚本,除非您完全信任其作者并了解其工作原理。您也可以在我们的社区脚本找到免费的开源替代方案。
作者的说明
DM me for access to the private indicators twitter.com/TheTimeCount
免责声明
这些信息和出版物并非旨在提供,也不构成TradingView提供或认可的任何形式的财务、投资、交易或其他类型的建议或推荐。请阅读使用条款了解更多信息。