JayRogers

Multi BB Heat Vis - SMA/EMA/Breakout - r2

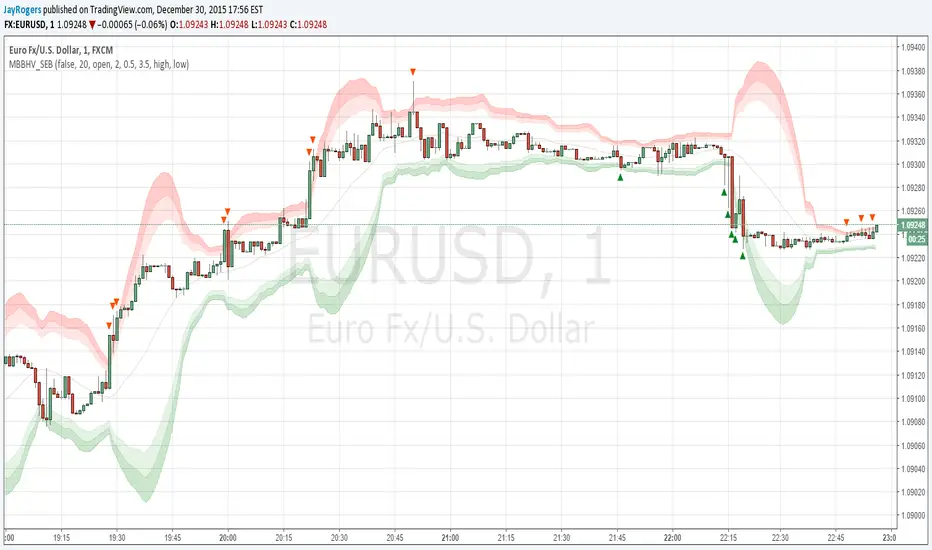
I don't expect to iterate any further on this script, unless any weird issue crops up.

Description and usage detailed in the comments at the top of the script. Cheers!

To repaint or not to repaint, all the relevant sources are exposed as inputs for customisation - so the choice is yours.

Cheers!
开源脚本

本着真正的TradingView精神,该脚本的作者将其开源发布,以便交易者可以理解和验证它。为作者喝彩!您可以免费使用它,但在出版物中重复使用此代码受网站规则的约束。 您可以收藏它以在图表上使用。

免责声明

这些信息和出版物并不意味着也不构成TradingView提供或认可的金融、投资、交易或其它类型的建议或背书。请在使用条款阅读更多信息。

想在图表上使用此脚本?
// @version=2

// Title:    "Multi BB Heat Vis - SMA/EMA/Breakout - r2".
// Revision: 2 (most likely final unless I find some serious issues)
// Author:   JayRogers
//
// Description / Usage:
//
//  - Three stacked SMA based Bollinger Bands designed just to give you a quick visual on the pressure/heat of movement.
//  - Set inner band as you would expect, then set your preferred multiplier increment for the additional outer 2 bands.
//  - Option to use EMA as alternative basis, rather than SMA.
//  - Breakout indication shapes, which have their own multiplier seperate from the BB's; but still tied to same length/period.
//  - Both high and low breakouts each have seperate selectable source options.
//
// r2 changes:
//
//  - cleaned and tightened up code a bit.
//  - revised title tags for customisation, to make things a little clearer.
//  - dropped [JR] tag, didn't realise someone else was using that.. less potential confusion between authors. Sorry other [JR]!

study(shorttitle="MBBHV_SEB", title="Multi BB Heat Vis - SMA/EMA/Breakout - r2", overlay=true)

// Inputs
bb_useEma   = input(false, title="Use EMA Basis?")
bb_length   = input(20, minval=1, title="Bollinger Length")
bb_source   = input(open, title="Bollinger Source")
bb_mult     = input(2.0, title="Base Multiplier", minval=0.1, maxval=25)
bb_multInc  = input(0.5, title="Multiplier Increment", minval=0.1, maxval=25)
bo_mult     = input(3.5, title="Breakout Multiplier", minval=0.5, maxval=25)
bo_hSource  = input(high, title="High Break Source")
bo_lSource  = input(low, title="Low Break Source")

bb_basis = bb_useEma ? ema(bb_source, bb_length) : sma(bb_source, bb_length)

// Deviation
bb_stdDev = stdev(bb_source, bb_length)
bb_devBase = bb_mult * bb_stdDev
bb_devInc1 = (bb_mult + bb_multInc) * bb_stdDev
bb_devInc2 = (bb_mult + (bb_multInc * 2)) * bb_stdDev
bo_dev = bo_mult * bb_stdDev

// plot basis
plot(bb_basis, title="Basis Line", color=silver, transp=50)

// plot and fill upper bands
bbu_A = plot((bb_basis + bb_devBase), title="Upper Band - A", color=red, transp=90)
bbu_B = plot((bb_basis + bb_devInc1), title="Upper Band - B", color=red, transp=85)
bbu_C = plot((bb_basis + bb_devInc2), title="Upper Band - C", color=red, transp=80)
fill(bbu_A, bbu_B, title="Upper Fill [ A - B ]", color=red, transp=90)
fill(bbu_B, bbu_C, title="Upper Fill [ B - C ]", color=red, transp=80)

// plot and fill lower bands
bbl_A = plot((bb_basis - bb_devBase), title="Lower Band - A", color=green, transp=90)
bbl_B = plot((bb_basis - bb_devInc1), title="Lower Band - B", color=green, transp=85)
bbl_C = plot((bb_basis - bb_devInc2), title="Lower Band - C", color=green, transp=80)
fill(bbl_A, bbl_B, title="Lower Fill [ A - B ]", color=green, transp=90)
fill(bbl_B, bbl_C, title="Lower Fill [ B - C ]", color=green, transp=80)

// center channel fill
fill(bbu_A, bbl_A, title="Center Channel Fill", color=silver, transp=100)

// plot breakouts
plotshape(bo_hSource >= (bb_basis + bo_dev), title="High Break", style=shape.triangledown, location=location.abovebar, size=size.tiny, color=red, transp=0)
plotshape(bo_lSource <= (bb_basis - bo_dev), title="Low Break", style=shape.triangleup, location=location.belowbar, size=size.tiny, color=green, transp=0)