OPEN-SOURCE SCRIPT
3. [Pufferman] - HA Candle Color Overlay
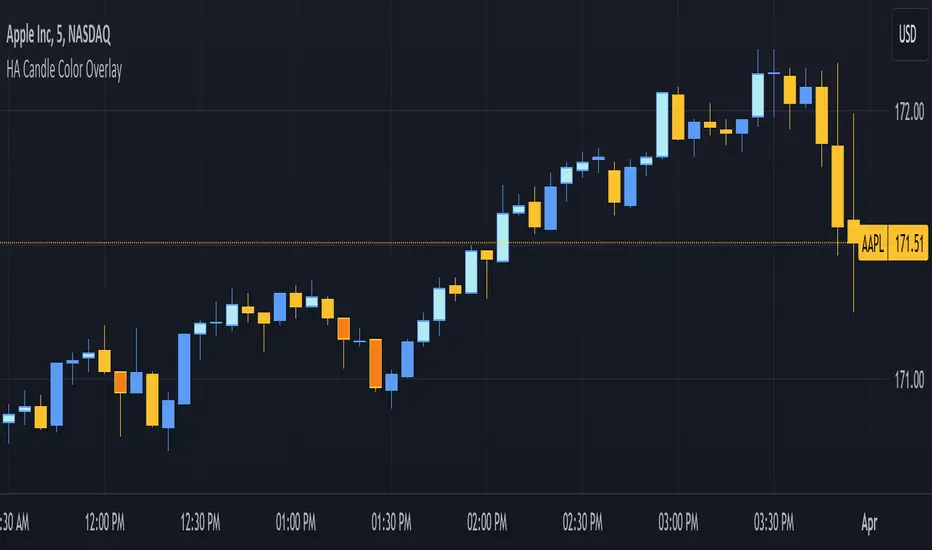
This indicator is designed for traders who utilize Heikin-Ashi (HA) candles to determine market trend direction and strength but prefer not to clutter their charts with multiple candlestick overlays or constantly switch between chart types. It aims to enhance chart readability by marking significant HA candles directly on the price chart, leveraging the unique characteristics of HA candles to signal trend direction and momentum.
Key Features:
1. Trend Identification through HA Candles: Automatically calculates Heikin-Ashi candles based on standard price data, highlighting significant HA candles that exhibit flat tops or bottoms. These characteristics are indicators of strong trend presence and direction. Highlights are in darker or lighter shade (darker - bearish or light - bullish colors) than the standard candles for easy read.
2. Cleaner Chart Presentation: Offers a streamlined alternative to overlaying HA candles on traditional candlestick charts or toggling between different chart views, keeping the user's interface uncluttered.
3. Selective Highlighting Based on Agreement: Marks traditional candles only when there's a concurrence between the HA candle's trend (bullish or bearish) and the traditional candle's trend. This feature ensures that only the most relevant signals are highlighted for the trader's attention.
Operational Mechanism: The script identifies HA candles with open equal to high (for flat tops) and open equal to low (for flat bottoms), which typically indicate strong trend movements. By marking these on the regular price chart, it provides immediate visual cues about trend strength and direction without needing to switch between HA and traditional candlestick views.
This tool is particularly useful for traders looking for a clean and efficient way to incorporate the insights of Heikin-Ashi candles into their technical analysis without the visual complexity of full HA candlestick overlays.
开源脚本
秉承TradingView的精神,该脚本的作者将其开源,以便交易者可以查看和验证其功能。向作者致敬!您可以免费使用该脚本,但请记住,重新发布代码须遵守我们的网站规则。
免责声明
这些信息和出版物并非旨在提供,也不构成TradingView提供或认可的任何形式的财务、投资、交易或其他类型的建议或推荐。请阅读使用条款了解更多信息。
开源脚本
秉承TradingView的精神,该脚本的作者将其开源,以便交易者可以查看和验证其功能。向作者致敬!您可以免费使用该脚本,但请记住,重新发布代码须遵守我们的网站规则。
免责声明
这些信息和出版物并非旨在提供,也不构成TradingView提供或认可的任何形式的财务、投资、交易或其他类型的建议或推荐。请阅读使用条款了解更多信息。