OPEN-SOURCE SCRIPT
Entropy Volatility Index [CHE]
I Entropy Volatility Index (EVI)
II An Experimental Script for Measuring Market Volatility
III Introduction
The Entropy Volatility Index (EVI) is an experimental indicator based on concepts from thermodynamics and information theory. The goal of the EVI is to quantify market uncertainty and volatility by calculating the entropy of price changes.
IV Basic Concepts
Entropy in Thermodynamics
Entropy is a measure of disorder or randomness in a system.
The second law of thermodynamics states that entropy in a closed system tends to increase over time.
Entropy in Information Theory
In information theory, entropy measures the uncertainty or information content of a random variable.
The entropy H of a random variable X with probability distribution P(x) is calculated as:
H(X) = -∑ P(x) log P(x)
V Derivation of the EVI
Calculation of Price Changes
Absolute price changes are calculated to serve as the basis for probability calculations.
Creation of the Histogram
A histogram is created and initialized to count the frequency of price changes.
Updating the Histogram
The histogram is updated by counting the frequency of each price change.
Calculation of Probabilities
The probabilities of the price changes are calculated based on their frequencies in the histogram.
Calculation of Entropy
Entropy is calculated using the probabilities of price changes. Higher entropy indicates higher uncertainty or disorder in the market.
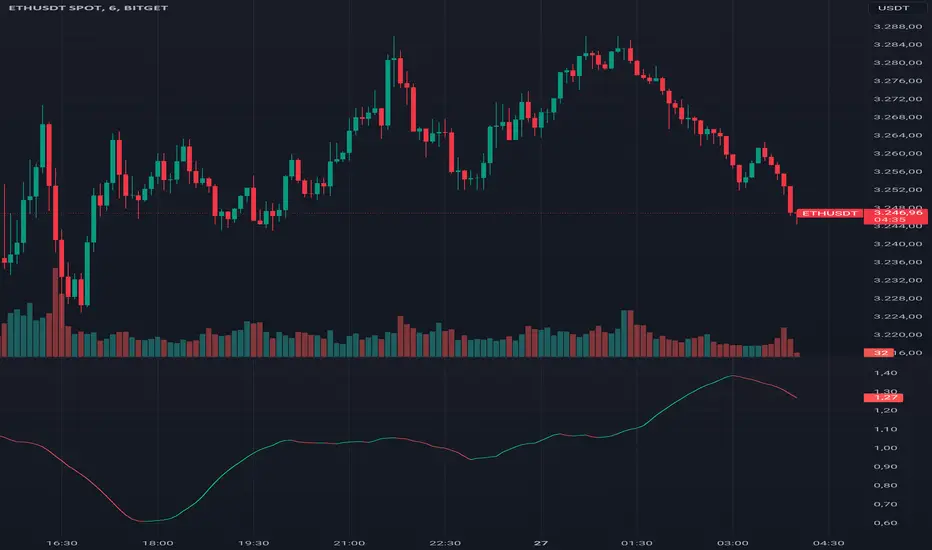
Plotting the Indicator
The EVI is plotted to visually represent market volatility and uncertainty.
VI Interpretation of the EVI
High EVI Values
High Volatility: Strong and irregular price movements.
High Uncertainty: Increased market uncertainty.
Possible Market Turning Points: Indicators of potential trend changes.
Low EVI Values
Low Volatility: More consistent and predictable price movements.
Stability: More stable market phases.
Trend Consistency: Indicators of stable trends or sideways movements.
VII Conclusion
The Entropy Volatility Index (EVI) is an experimental script that applies concepts from thermodynamics and information theory to measure market volatility. It offers a new perspective on market uncertainty and can be used as an additional tool for traders.
VIII Example Use Cases
Identifying Volatile Phases: Use the EVI to identify periods of high volatility and prepare for potential rapid price movements.
Risk Management: Adjust your risk management strategy based on the EVI. During high EVI periods, consider hedging positions or adjusting position sizes.
Complementing Other Indicators: Combine the EVI with other technical indicators (e.g., RSI, MACD) for a more comprehensive view of market conditions.
I hope this experimental script provides valuable insights. Thank you for your feedback and suggestions for improvement.
Best regards,
Chervolino
II An Experimental Script for Measuring Market Volatility
III Introduction
The Entropy Volatility Index (EVI) is an experimental indicator based on concepts from thermodynamics and information theory. The goal of the EVI is to quantify market uncertainty and volatility by calculating the entropy of price changes.
IV Basic Concepts
Entropy in Thermodynamics
Entropy is a measure of disorder or randomness in a system.
The second law of thermodynamics states that entropy in a closed system tends to increase over time.
Entropy in Information Theory
In information theory, entropy measures the uncertainty or information content of a random variable.
The entropy H of a random variable X with probability distribution P(x) is calculated as:
H(X) = -∑ P(x) log P(x)
V Derivation of the EVI
Calculation of Price Changes
Absolute price changes are calculated to serve as the basis for probability calculations.
Creation of the Histogram
A histogram is created and initialized to count the frequency of price changes.
Updating the Histogram
The histogram is updated by counting the frequency of each price change.
Calculation of Probabilities
The probabilities of the price changes are calculated based on their frequencies in the histogram.
Calculation of Entropy
Entropy is calculated using the probabilities of price changes. Higher entropy indicates higher uncertainty or disorder in the market.
Plotting the Indicator
The EVI is plotted to visually represent market volatility and uncertainty.
VI Interpretation of the EVI
High EVI Values
High Volatility: Strong and irregular price movements.
High Uncertainty: Increased market uncertainty.
Possible Market Turning Points: Indicators of potential trend changes.
Low EVI Values
Low Volatility: More consistent and predictable price movements.
Stability: More stable market phases.
Trend Consistency: Indicators of stable trends or sideways movements.
VII Conclusion
The Entropy Volatility Index (EVI) is an experimental script that applies concepts from thermodynamics and information theory to measure market volatility. It offers a new perspective on market uncertainty and can be used as an additional tool for traders.
VIII Example Use Cases
Identifying Volatile Phases: Use the EVI to identify periods of high volatility and prepare for potential rapid price movements.
Risk Management: Adjust your risk management strategy based on the EVI. During high EVI periods, consider hedging positions or adjusting position sizes.
Complementing Other Indicators: Combine the EVI with other technical indicators (e.g., RSI, MACD) for a more comprehensive view of market conditions.
I hope this experimental script provides valuable insights. Thank you for your feedback and suggestions for improvement.
Best regards,
Chervolino
开源脚本
秉承TradingView的精神,该脚本的作者将其开源,以便交易者可以查看和验证其功能。向作者致敬!您可以免费使用该脚本,但请记住,重新发布代码须遵守我们的网站规则。
免责声明
这些信息和出版物并非旨在提供,也不构成TradingView提供或认可的任何形式的财务、投资、交易或其他类型的建议或推荐。请阅读使用条款了解更多信息。
开源脚本
秉承TradingView的精神,该脚本的作者将其开源,以便交易者可以查看和验证其功能。向作者致敬!您可以免费使用该脚本,但请记住,重新发布代码须遵守我们的网站规则。
免责声明
这些信息和出版物并非旨在提供,也不构成TradingView提供或认可的任何形式的财务、投资、交易或其他类型的建议或推荐。请阅读使用条款了解更多信息。