OPEN-SOURCE SCRIPT
ÇOKLU ZAMAN TABLOSU
Merhaba dostlar,
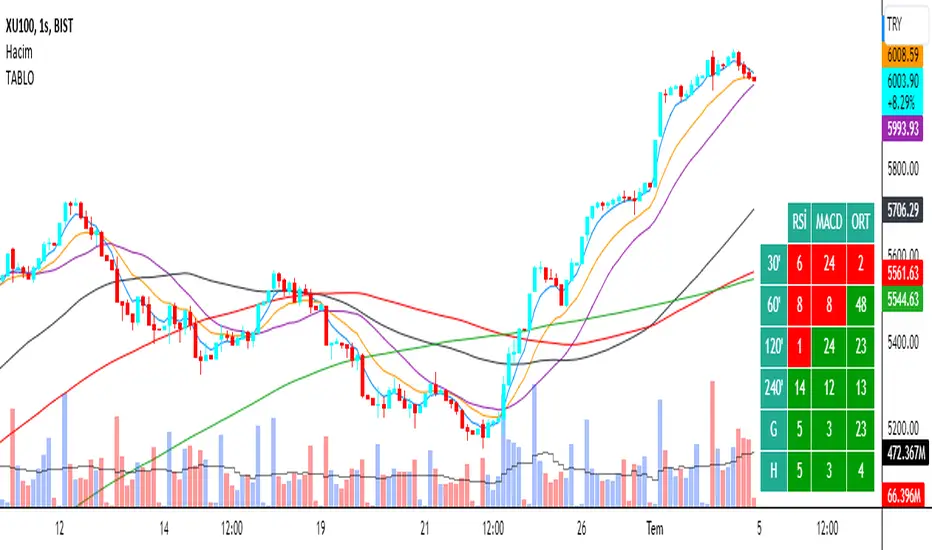
Sizler için yine güzel ve kullanışlı bir indikatör yayınlıyoruz. Bu indikatör sayesinde belirlediğiniz koşulların tüm zamanlardaki durumunu tablodan anlık olarak takip edebileceksiniz. Ayrıca koşulunuzun en son ne zaman gerçekleştiğini yine tabloda görebileceksiniz.
Tablodaki renklerin anlamları şu şekilde;
• Mavi 0 => son barda al sinyali gelmiştir.
• Siyah 0 => son barda sat sinyali gelmiştir.
• Yeşil => yazan değer bar önce al koşulu gerçekleşmiştir.
• Kırmızı => yazan değer bar önce sat koşulu gerçekleşmiştir.
Ayrıca kullanabileceğiniz türü ve değeri değiştirilebilir 6 adet ortalama mevcut.
İyi günlerde kullanın. Teşekkür etmek isterseniz çevrenizdeki bir çift gözü mutlu etmeniz yeterli.
-----------------------------------------------------------------------------------------------------------------------------------------------------------------------------------
Hello friends,
we are once again presenting you a beautiful and useful indicator. With this indicator, you will be able to instantly track the status of the conditions you have set in the table throughout all time periods. Additionally, you will be able to see when your condition was last met in the table.
The meanings of the colors in the table are as follows:
• Blue 0 => Buy signal occurred on the last bar.
• Black 0 => Sell signal occurred on the last bar.
• Green => The value indicated that the buy condition was met earlier in the bar.
• Red => The value indicated that the sell condition was met earlier in the bar.
Furthermore, there are 6 adjustable types of averages that you can use.
Use it in good days. If you wish to show your appreciation, simply make someone's eyes around you happy.
开源脚本
秉承TradingView的精神,该脚本的作者将其开源,以便交易者可以查看和验证其功能。向作者致敬!您可以免费使用该脚本,但请记住,重新发布代码须遵守我们的网站规则。
免责声明
这些信息和出版物并非旨在提供,也不构成TradingView提供或认可的任何形式的财务、投资、交易或其他类型的建议或推荐。请阅读使用条款了解更多信息。
免责声明
这些信息和出版物并非旨在提供,也不构成TradingView提供或认可的任何形式的财务、投资、交易或其他类型的建议或推荐。请阅读使用条款了解更多信息。